Daily Market Report - 18th Sep 2020


$50 Free Margin Account Campaign:
https://www.nooralmal.com/cc19...
EURUSD
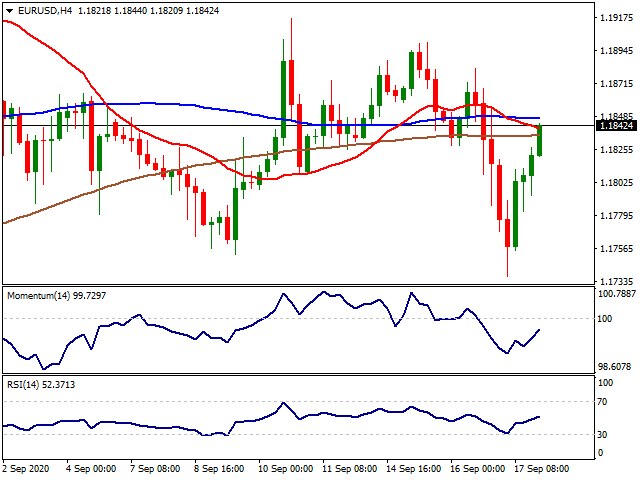
The EUR/USD pair fell to 1.1736 its lowest in over a month, on the heels of demand for safety, spurred by the US Federal Reserve on Wednesday. Equities plunged in Asia, dragging their overseas counterparts to the downside. European indexes, however, shrug off most of the intraday losses, helping the pair to recover some ground. It currently trades at around 1.1840, despite Wall Street’s sour tone.
The EU published August inflation figures, with the annual CPI confirmed at -0.2% as previously estimated. As for the US, the country has just published Initial Jobless Claims for the week ended September 11, which came in at 860K improving from 893K in the previous week but worse than the 850K anticipated. The country also published August Building Permits and Housing Starts, which increased by less than anticipated. Sour US data added to the dollar’s negative tone. This Friday, the EU will publish its July Current Account, while the US will unveil the preliminary estimate of the September Michigan Consumer Sentiment Index, foreseen at 75 from 74.1 in the previous month.
The EUR/USD pair has corrected extreme oversold conditions, but the risk remains skewed to the downside, according to intraday technical readings. The 4-hour chart shows that the pair is trading below all of its moving averages, which remain all together in a 20 pips’ range, while technical indicators posted modest recoveries within negative levels. The pair is back to trade within familiar levels and would need to extend its advance beyond the 1.1880 price zone to have chances of rallying further.
Support levels: 1.1795 1.1750 1.1710
Resistance levels: 1.1840 1.1880 1.1915
USDJPY
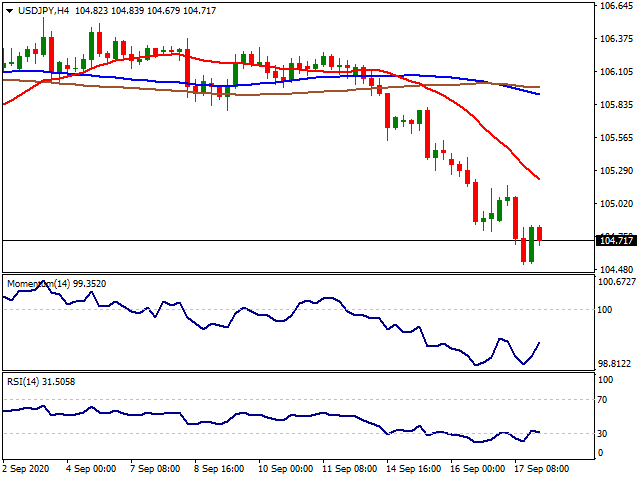
The USD/JPY pair is ending Thursday in the 104.70 price zone, after hitting a daily low of 104.52. The pair fell at the beginning of the day on the back of risk-aversion and remained depressed throughout the day as worldwide indexes spent it in the red. US Treasury yields failed to provide directional clues, as they traded within well-limited ranges, ending the day unchanged.
Early in the Asian session, the Bank of Japan announced its latest monetary policy decision, and, as widely expected, the central bank left its monetary policy unchanged, while upgrading its economic assessment. Policymakers said that the economy has started to pick up “gradually,” following the setback caused by the coronavirus pandemic. As usual, they reiterated that would add easing if necessary, although without hinting any action for the foreseeable future. This Friday, Japan will publish August National inflation figures.
The USD/JPY pair retains its bearish stance, heading into the last trading day of the day. The 4-hour chart shows that it remains below a firmly bearish 20 SMA, which keeps accelerating south below the larger ones. The 100 SMA has crossed below the 200 SMA, indicating strong selling interest. Technical indicators, in the meantime, have stabilized well into negative territory, after correcting extreme oversold conditions. The pair has room to extend its decline towards 104.18, July low, should the pressure remain on the greenback.
Support levels: 104.70 104.20 103.85
Resistance levels: 105.10 105.50 106.00
GBPUSD
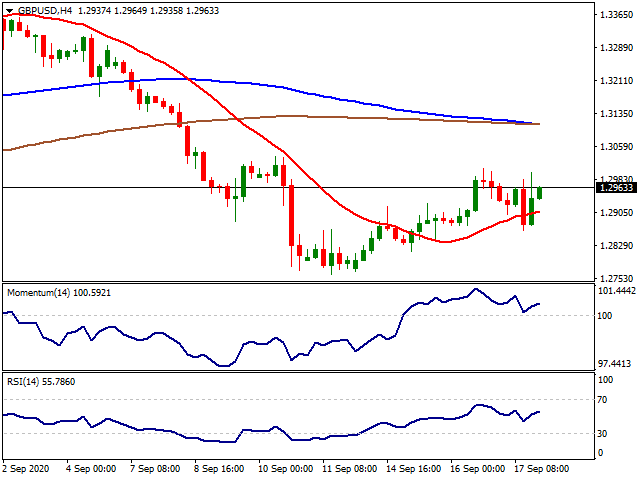
The GBP/USD pair is ending the day with modest losses around 1.2960, although up from a daily low of 1.2864. The Pound got an unexpected boost from EU Commission President Ursula von der Leyen, who said that she believes a trade deal with the UK was still possible despite the “distraction” caused by Boris Johnson’s Internal Market Bill, which helped the pair hit a daily high of 1.2998.
Meanwhile, the BOE announced its latest monetary policy decision. The MPC voted 9-0 to keep rates and QE unchanged, as expected. However, policymakers mentioned negative rates, which spurred some selling around Pound’s crosses. The UK will publish this Friday, August Retail Sales, seen up by 0.4% when compared to July.
From a technical point of view, the GBP/USD pair has a limited bullish potential, but chances of a downward move are even lower. The 4-hour chart shows that the pair is currently developing above a mildly bullish 20 SMA, while below the 100 and 200 SMA, both converging around 1.3130. Technical indicators, in the meantime, remain above their midlines but without directional strength.
Support levels: 1.2915 1.2860 1.2810
Resistance levels: 1.3000 1.3050 1.3095
AUDUSD
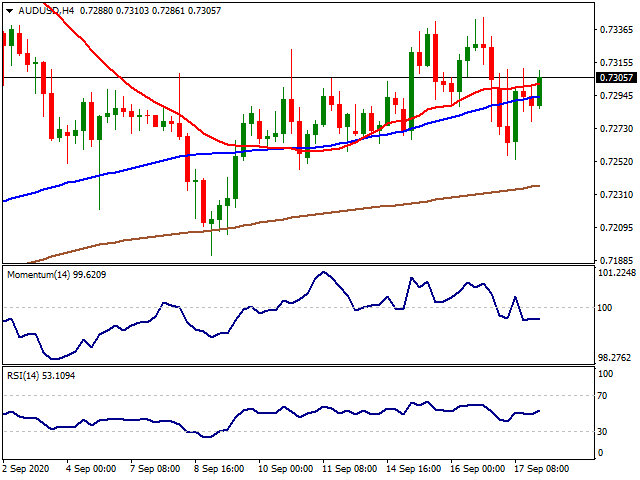
The AUD/USD pair keeps hovering around the 0.7300 level at the end of this Thursday, still unable to attract speculative interest. The pair has spent the week around the current level, confined to tight intraday ranges. Australian August employment data beat the market’s expectations, as the country added 111K new jobs in the month, much better than the 50K loss expected. Even further, the unemployment rate shrank to 6.8% from 7.5%. The report, however, was unable to offset the risk-off mood. Australia won’t publish macroeconomic data this Friday.
The technical picture for AUD/USD hasn’t changed, still neutral. The 4-hour chart shows that the pair continues seesawing around the 20 and 100 SMA, which head marginally higher above the 200 SMA. Technical indicators, however, remain below their midlines without clear directional strength. As said on a previous update, the upside seems limited with the risk now skewed to the downside. A steeper decline is likely on a break below 0.7250, the immediate support level.
Support levels: 0.7250 0.7215 0.7170
Resistance levels: 0.7310 0.7350 0.7385
GOLD
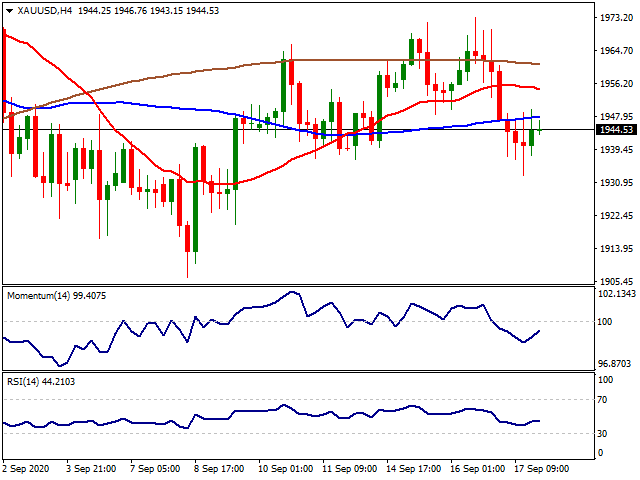
Gold dropped to ten-day lows amid a recovery of the U.S. dollar. During the American session, the greenback lost momentum, and equity prices moved off lows favouring a recovery in XAU/USD. The metal continues to move sideways, like U.S. yields, not following the rally of the yen. Economic data from the U.S. came in mixed, having no impact on markets. With the DXY approaching weekly lows, a break lower could trigger some demand for gold, that is still neutral. With a light economic calendar ahead, market sentiment will likely be the key driver. Gold does not look strong enough for a rally to $2,000 and not so fragile for a slide to $1,900.
From a technical perspective, gold remains neutral and biased to the downside while below $1,950; as it stands under flat relevant short-term moving averages. Above $1,950 it could start trading again in a higher range being the upper limit, the critical resistance at the $1,975 zone. XAU/USD traded below the $1,935 support on Thursday but quickly rose back above. A consolidation under $1,935 would sign more weakness ahead, favouring a test of $1,900.
Support Levels: $1,950 $1,937 $1,905
Resistance Levels: $1,978 $2,000 $2,015
SILVER
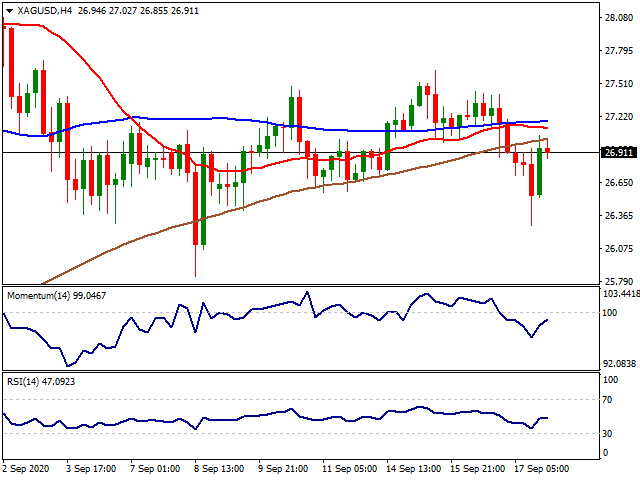
Silver lost ground for the second day in a row, but it ended on a positive note, far from the bottom and above $27.00, looking bullish ahead of the Asian session. Overall, both metals continue to move sideways, awaiting an overdue breakout. XAG/USD fell to as low at $26.27, lowest since September 8 before bouncing to the upside. The driver was the recovery of the U.S. dollar and a decline in equity prices. As market sentiment improved, commodities turned to the upside, trimming losses. Financial markets continue to trade mostly in ranges, excluding some emerging market currencies that are at monthly highs versus the U.S. dollar. Still, the optimism is not favouring the demand for metals.
XAG/USD is above $27.00 and testing short-term moving averages. Above $27.20, the bullish momentum will intensify, opening the door for a test of $27.50. A daily close well above $27.40 is needed to end the current consolidation phase. If silver fails around current levels and drops back below $27.00, it could test the support at $26.20 again; a firm break lower would suggest more losses ahead.
Support Levels: $26.50 $26.00 $25.00
Resistance Levels: $27.45 $28.50 $29.15
CRUDE WTI
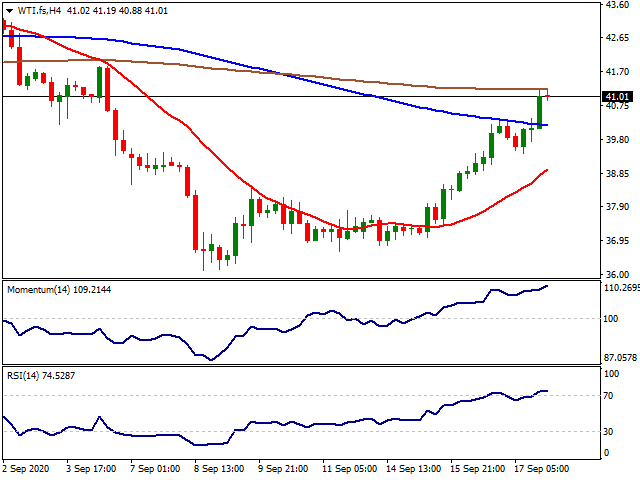
Crude prices extended the rally into a fifth consecutive day on Thursday, with West Texas Intermediate benchmark adding more than 2% to trade above $41 after an Organization of the Petroleum Exporting Countries and its allies (OPEC+) videoconference meeting. In a statement, the Joint Ministerial Monitoring Committee (JMMC) recommended extending the compensation period for overproduction, which was set to finish in September, until the end of December. Given the drop in global oil demand, the JMMC also said that participating countries should be willing to take additional measures. Investors were also monitoring the consequences of the Hurricane Sally on oil production in the Gulf of Mexico.
WTI price broke above the $40.40-50 resistance area and struck a daily high of $41.20, before steading around the $41 level. The short-term technical picture remains bullish, although the RSI is in overbought territory in the 4-hour chart, while the price stalled at the 200-period SMA, all of which could suggest a pause over the next hours. The $41.80-42.00 zone would be the next upside target. On the downside, immediate support could be found at the $38.40 area, followed by the 100-day SMA at $37.90.
Support levels: $38.40 $37.90 $36.80
Resistance levels: $41.40 $41.80 $42.00
DOW JONES
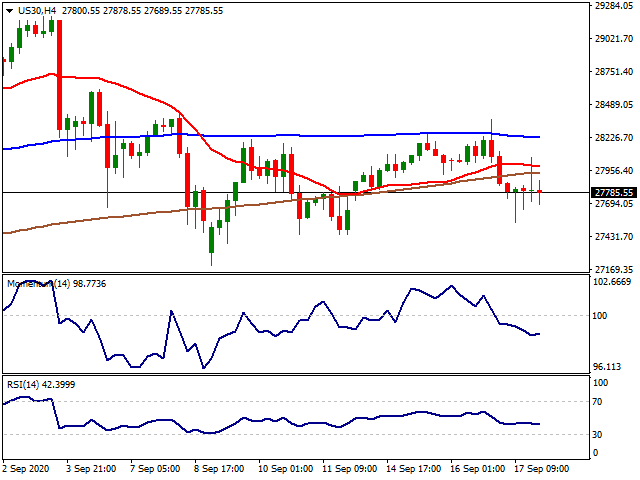
US stocks edged lower on Thursday with the three main Wall Street indexes closing in the red as investors assessed the Federal Reserve economic outlook and mixed US economic data. On Wednesday, the Fed emphasized the slow economic recovery, casting a shadow over investor’s confidence. The Dow Jones Industrial Average index lost 130 points, or 0.47%, closing at 27,901. However, the index managed to trim intraday losses after touching a low of 27,647. Meanwhile, the S&P 500 index lost 28 points, or 0.84%, and closed at 3,357. The Nasdaq Composite was the worst-hit index dropping 140 points, or 1.27%, to 10,910.
From a technical viewpoint, the DJIA holds a short-term positive bias despite today’s pullback. However, the index is trading back below the 20-day SMA, which offers immediate resistance at the 28,150 zone. A breakout here could expose August monthly high at 28,735. On the flip side, immediate supports line up at 27,400 and 27,000. Still, the 26,300 zone is the key support level in order to keep focus on the upside. A loss of this area could threaten the short-term bullish set-up.
Support Levels: 27,400 27,000 26,300
Resistance Levels: 28,200 28,750 29,200
MACROECONOMIC EVENTS
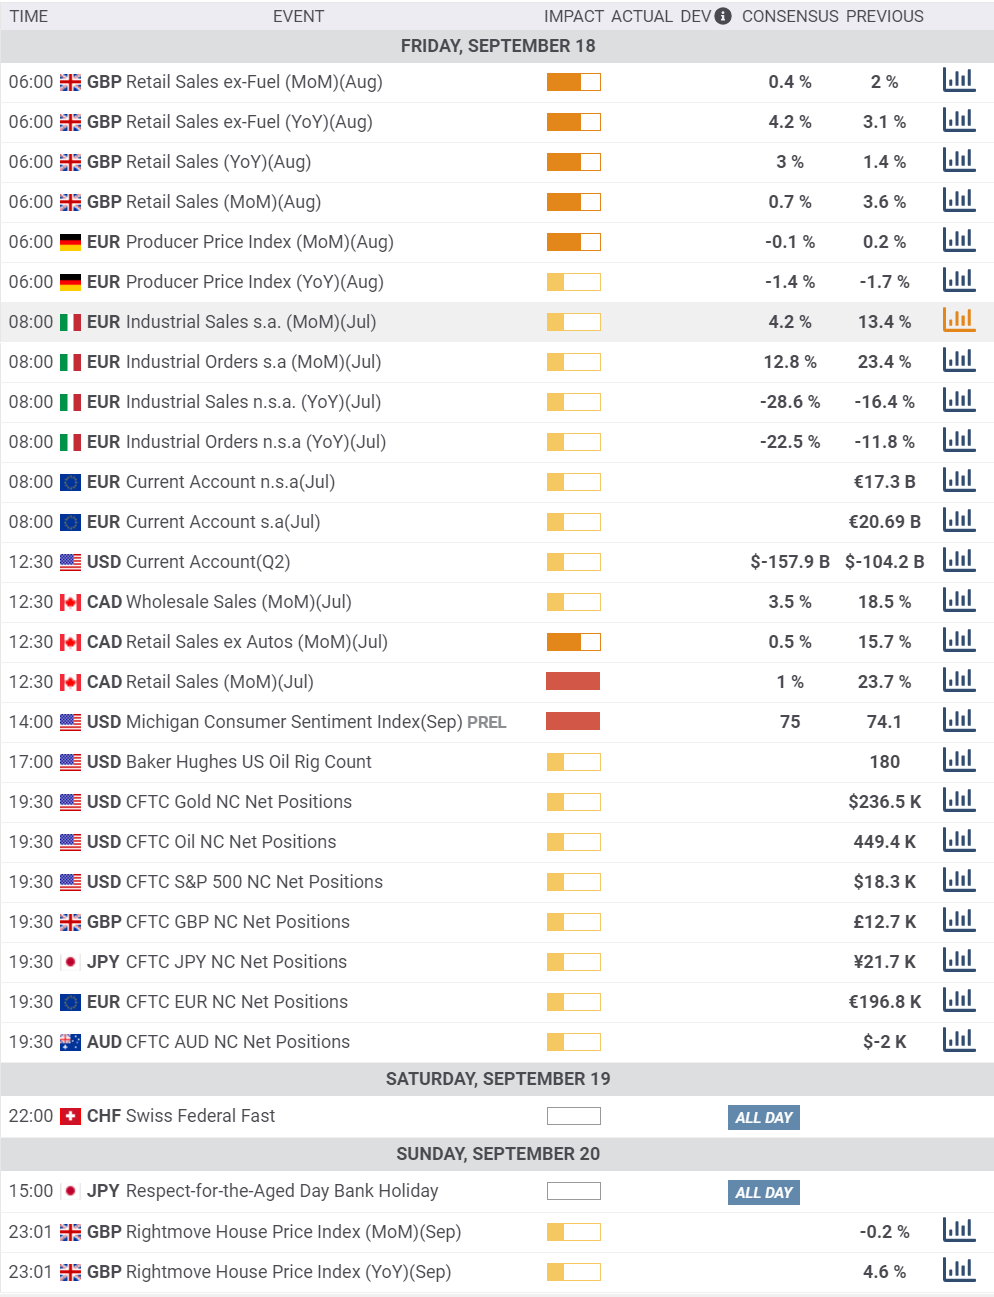
* All the Moving Average support and resistance levels are dynamic by nature. Means when the price approaches the Moving averages, slight variation occurs in the forecasted Moving Average support and resistance levels. Previous few days’ intraday levels are also signicant while trading the current day as the price tend to hover around these levels for some time. Levels in red indicate strong, critical or vital.
Please remember that trading financial markets carry a high degree of risk to your capital. It is possible to lose more than your initial stake. Leveraged products may not be suitable for all investors, therefore please ensure you fully understand the risks involved and seek independent advice if necessary.
All Rights Reserved © Noor Al Mal
#9月美联储决议“鸽声依旧”##TikTok不卖了##欧央行决议按兵不动##无协议脱欧风险又来##美股狂飙要到头了吗#
Disclaimer: The content above represents only the views of the author or guest. It does not represent any views or positions of FOLLOWME and does not mean that FOLLOWME agrees with its statement or description, nor does it constitute any investment advice. For all actions taken by visitors based on information provided by the FOLLOWME community, the community does not assume any form of liability unless otherwise expressly promised in writing.
FOLLOWME Trading Community Website: https://www.followme.com


Hot
No comment on record. Start new comment.