AUD/USD: AUSTRALIAN BUSINESS ACTIVITY DATA FELL SHORT OF INVESTORS' EXPECTATIONS

| Scenario | |
|---|---|
| Timeframe | Intraday |
| Recommendation | BUY |
| Entry Point | 0.6375 |
| Take Profit | 0.6400 |
| Stop Loss | 0.6355 |
| Key Levels | 0.6200, 0.6250, 0.6300, 0.6330, 0.6356, 0.6379, 0.6400, 0.6425 |
| Alternative scenario | |
|---|---|
| Recommendation | SELL STOP |
| Entry Point | 0.6330 |
| Take Profit | 0.6270 |
| Stop Loss | 0.6356 |
| Key Levels | 0.6200, 0.6250, 0.6300, 0.6330, 0.6356, 0.6379, 0.6400, 0.6425 |
Current trend
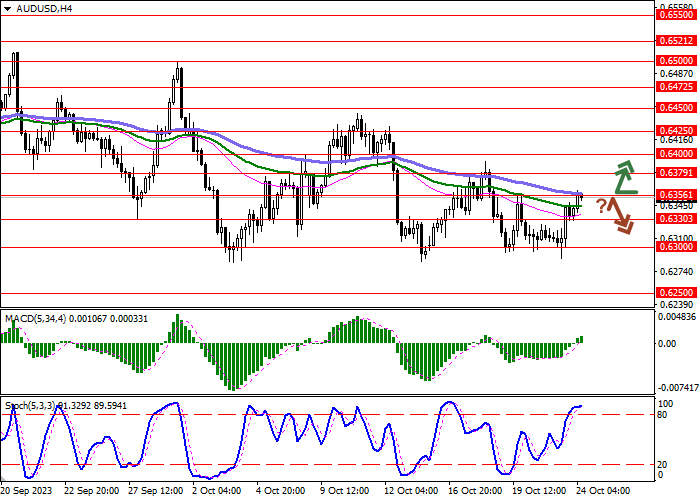
The AUD/USD pair is showing active growth, developing the corrective impetus formed the day before. The instrument is testing 0.6360 for a breakout, updating local highs from October 18. Trading participants are closing part of their long positions in the US currency ahead of the US Federal Reserve meeting at the end of the month. The regulator is not expected to take steps towards tightening monetary policy, while counting on maintaining the same rhetoric, which, in particular, allows for the possibility of raising the interest rate in the future.
In turn, macroeconomic statistics from Australia exert moderate pressure on the position of the instrument. The Commonwealth Bank Services PMI fell from 51.8 points to 47.6 points in October, and the S&P Global Manufacturing PMI fell from 48.7 points to 48.0 points. At the same time, the Commonwealth Bank Composite PMI fell from 51.5 points to 47.3 points.
On Wednesday, Australia will release September inflation statistics. Forecasts assume an acceleration of the Consumer Price Index from 5.2% to 5.4% on a monthly basis and from 0.8% to 1.1% on a quarterly basis. In annual terms, the indicator may slow down from 6.0% to 5.3%.
Support and resistance
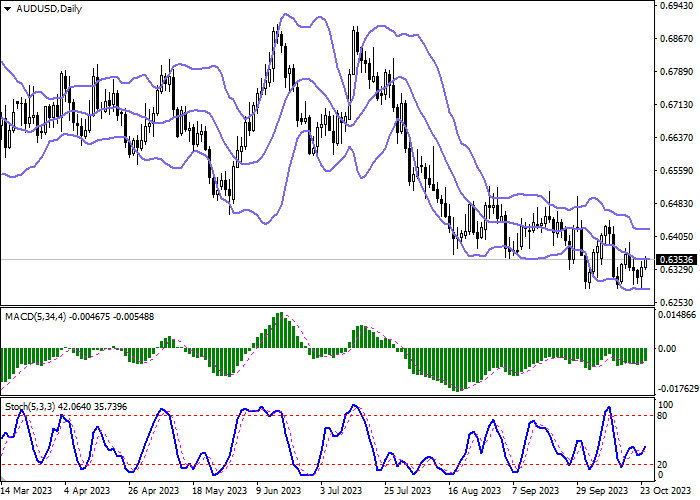
Bollinger Bands in D1 chart demonstrate flat dynamics. The price range is almost unchanged, but it remains rather spacious for the current level of activity in the market. MACD indicator is growing, while preserving a rather stable buy signal (located above the signal line). Stochastic shows similar dynamics, retreating from its lows, signaling the risks of the instrument being oversold in the near future.
Resistance levels: 0.6356, 0.6379, 0.6400, 0.6425.
Support levels: 0.6330, 0.6300, 0.6250, 0.6200.

Trading tips
Long positions can be opened at the current price with the target at 0.6400. Stop loss — 0.6355. Implementation time: 1-2 days.
A rebound from 0.6356 as from resistance, followed by a breakdown of 0.6330 may become a signal for opening of new short positions with the target at 0.6270. Stop-loss — 0.6356.
Disclaimer: The content above represents only the views of the author or guest. It does not represent any views or positions of FOLLOWME and does not mean that FOLLOWME agrees with its statement or description, nor does it constitute any investment advice. For all actions taken by visitors based on information provided by the FOLLOWME community, the community does not assume any form of liability unless otherwise expressly promised in writing.
FOLLOWME Trading Community Website: https://www.followme.com


Hot
No comment on record. Start new comment.