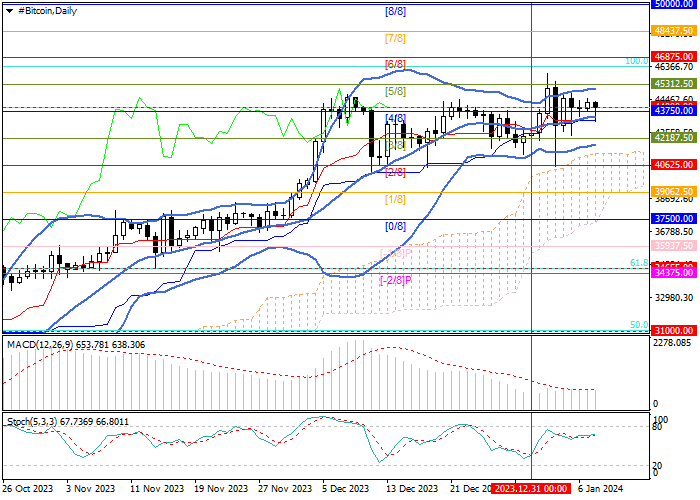
Current trend
Last week, the BTC/USD pair had ambiguous dynamics: at first, the price reached the area of 45950.00, rising above the level of 45000.00 for the first time since April 2022, however, it could not hold its positions, and then the token fell to 43380.00.
Currently, the asset has stabilized at 44000.00, as investors await reports on the upcoming launch of the first bitcoin ETF in the United States. Recall that on Friday, BlackRock Inc., Grayscale Investments, Fidelity Investments, VanEck, Valkyrie Enterprises, Hashdex, Franklin Templeton, Bitwise, Wisdomtree, ARK Invest, 21Shares, Galaxy, and Invesco made final edits to their applications for the creation of new exchange instruments, and on January 10, according to sources of the Reuters news agency, the U.S. Securities and Exchange Commission (SEC) will hold a vote, and the probability of positive results for the digital market is estimated to be very high. It should be noted that expert assessments regarding the dynamics of the BTC/USD pair after the launch of the new exchange-traded fund vary greatly: most analysts expect that quotes will continue to grow significantly against the background of an influx of funds from institutional investors; however, there are those who fear that the actions of the SEC will lead to profit-taking and serve as a driver of a long-term correction. A third scenario is also possible, in which the pullback will be replaced by positive dynamics, since the token will receive support from medium-term factors related to the expectation of the US Fed's transition to lower borrowing costs and increased geopolitical tensions in the Middle East, which, in turn, will attract new investments into the cryptocurrencies.
Support and resistance
Now the price is in the area of 44000.00, waiting for new drivers. The key for the "bulls" is the 45312.50 mark (Murrey level [5/8]), consolidation above which will lead to further growth to the levels of 46875.00 (Murrey level [6/8]), 48437.50 (Murrey level [7/8]), 50000.00 (Murrey level [8/8]). After a breakdown of the level of 42187.50 (Murrey level [3/8], the lower line of Bollinger Bands), the decline may resume to 40625.00 (Murrey level [2/8]) and 39062.50 (Murrey level [1/8]).
Technical indicators do not give a clear signal: Bollinger Bands are reversing up, MACD is stable in the positive zone, and Stochastic is horizontal.
Resistance levels: 43750.00, 46875.00, 48437.50, 50000.00.
Support levels: 42187.50, 40625.00, 39062.50.

Trading tips
Long positions can be opened above the 43750.00 mark with targets at 46875.00, 48437.50, 50000.00 and stop-loss at 44700.00. Implementation period: 5–7 days.
Short positions can be opened below 42187.50 with targets at 40625.00, 39062.50 and stop-loss at 43000.00.


Hot
No comment on record. Start new comment.