Current trend
The FTSE 100 index shows corrective dynamics, trading around 7689.0, remaining one of the poorest stock indies among developed countries. Its recent increase is due to positive reporting from component companies and UK macroeconomic statistics.
Thus, the core retail sales index gained 3.3% in January after a correction of −3.5% a month earlier, which contributed to the increase of 0.7% YoY after a decline of −2.1% last year. January retail sales increased by 0.7%, with preliminary estimates –1.4%, and YoY – by 3.4%, exceeding the predicted 1.5% and reflecting the fastest pace in three years, a positive signal for the national economy, which entered recession in December.
Against this background, the situation in the domestic bond market, where growth is still observed, faded into the background. Thus, 10-year securities are trading at a rate of 4.144%, which exceeds last week’s rate of 4.056%, and 20-year securities are held at 4.627%.
The growth leaders in the index are NatWest Group plc. ( 7.09%), Antofagasta plc. ( 5.65%), Lloyds Banking Group plc. ( 3.90%), and Weir Group plc. ( 3.86%).
Among the top decliners are Airtel Africa plc. (−3.22%), Vodafone Group plc. (−1.41%), and Ocado Group plc. (−0.56%).
Support and resistance
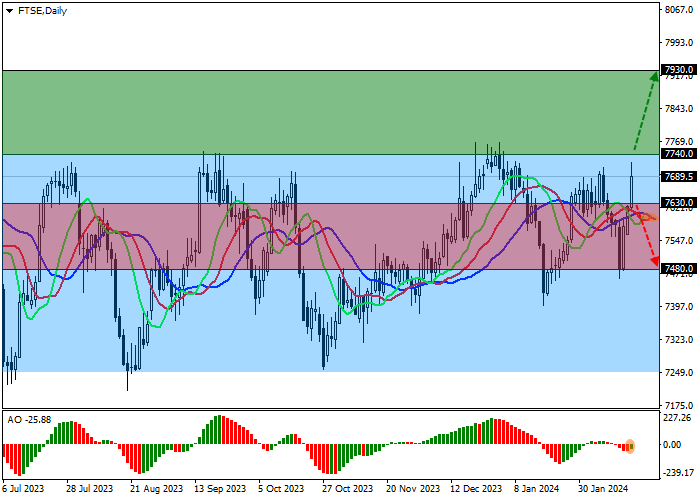
On the daily chart, the trading instrument continues the local correction and rises again towards the sideways channel resistance line 7740.0–7250.0.
Technical indicators strengthen the buy signal: the EMA fluctuation range on the Alligator indicator expands, and the histogram of the AO oscillator forms corrective bars, rising in the buy zone.
Resistance levels: 7740.0, 7930.0.
Support levels: 7630.0, 7480.0.

Trading tips
Long positions may be opened after a consolidation above the resistance level of 7740.0 with the target at 7930.0. Stop loss – 7640.0. Implementation period: 7 days or more.
Short positions may be opened after a consolidation below the support level of 7630.0 with the target at 7480.0. Stop loss – 7700.0.


Hot
No comment on record. Start new comment.