Saham Johnson & Johnson, salah satu perusahaan ritel terkemuka, terkoreksi di sekitar 160.00.
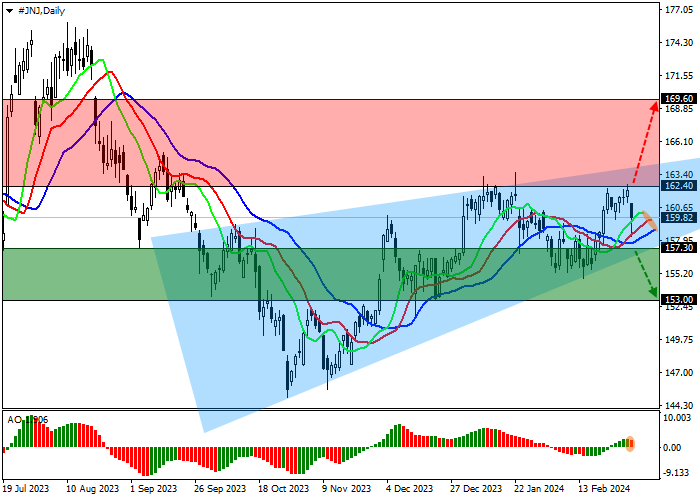
Pada grafik harian, harga mendekati garis support Triangle pattern dengan batas dinamis 155.00–163.00.
Pada grafik empat jam, jelas bahwa formasi tersebut belum memulai implementasi, namun kemungkinan menembus batas bawahnya di 157.00 tetap ada, dan dalam hal ini, penurunan akan berlanjut ke terendah musim gugur di 147.00. Jika harga tetap berada dalam pola tersebut, diperkirakan akan terjadi pembalikan dan kembali ke garis resistance di 164.00.
Indikator teknis melemahkan sinyal beli: kisaran fluktuasi EMA pada indikator Alligator menyempit, dan histogram AO membentuk bilah ke bawah tepat di atas level transisi.
Tips perdagangan
Posisi sell dapat dibuka setelah harga turun dan berkonsolidasi di bawah 157.30 dengan target di 153.00. Stop loss – 160.00. Periode implementasi: 7 hari atau lebih.
Posisi buy dapat dibuka setelah harga naik dan berkonsolidasi di atas 162.40 dengan target di 169.60. Stop loss – 160.00.
Disclaimer: The content above represents only the views of the author or guest. It does not represent any views or positions of FOLLOWME and does not mean that FOLLOWME agrees with its statement or description, nor does it constitute any investment advice. For all actions taken by visitors based on information provided by the FOLLOWME community, the community does not assume any form of liability unless otherwise expressly promised in writing.


Hot
No comment on record. Start new comment.