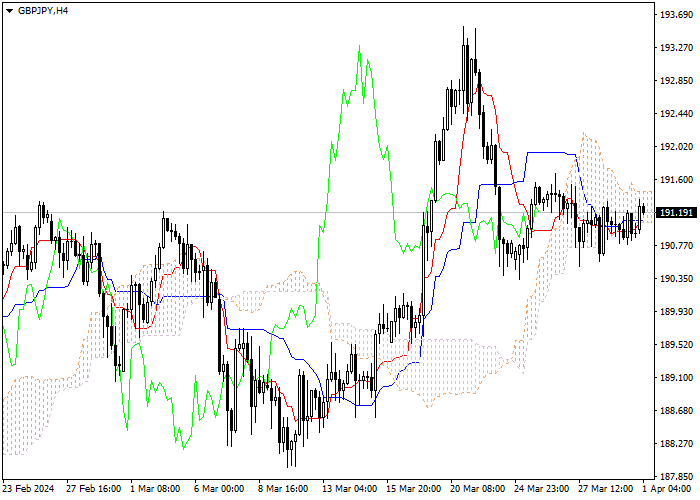
Let's look at the four-hour chart. Tenkan-sen line is below Kijun-sen, the lines are horizontal . Confirmative line Chikou Span is above the price chart, current cloud is ascending. The instrument is trading above Tenkan-sen and Kijun-sen lines; the Bullish trend is still strong. The closest support level is the lower border of the cloud (191.579). The closest resistance level is the upper border of the cloud (192.340).
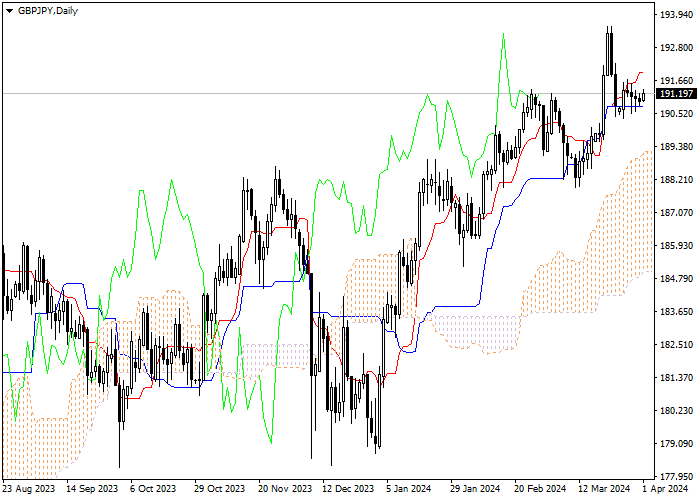
On the daily chart Tenkan-sen line is above Kijun-sen, the lines are horizontal . Confirmative line Chikou Span is above the price chart, current cloud is ascending. The instrument is trading between Tenkan-sen and Kijun-sen lines. The closest support level is Kijun-sen line (190.580). One of the previous maximums of Chikou Span line is expected to be a resistance level (193.053).
It is recommended to open long positions at current price with Take Profit at the level of previous maximum of Chikou Span (192.340) line and Stop Loss at the level of Kijun-sen line (191.579).
Disclaimer: The content above represents only the views of the author or guest. It does not represent any views or positions of FOLLOWME and does not mean that FOLLOWME agrees with its statement or description, nor does it constitute any investment advice. For all actions taken by visitors based on information provided by the FOLLOWME community, the community does not assume any form of liability unless otherwise expressly promised in writing.


Hot
No comment on record. Start new comment.