Current trend
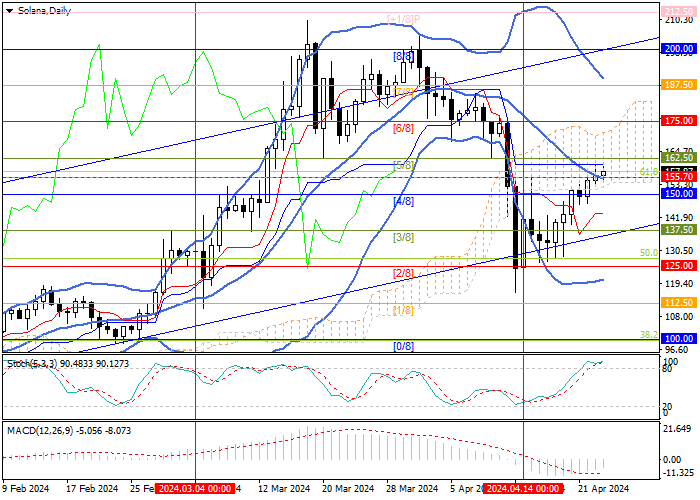
The SOL/USD pair is trading within the long-term ascending channel at 157.76: last week, the price actively tested its lower border, but could not break below it and resumed growth.
Currently, the quotes have risen above the 155.70 mark (61.8% Fibonacci retracement), supported by the central line of Bollinger Bands, which opens up the possibility of developing upward dynamics towards the targets of 187.50 (Murrey level [7/8]), 200.00 (Murrey level [8/8]), and 212.50 (Murrey level [ 1/8]). The key for the "bears" is the 137.50 mark (Murrey level [3/8]), after consolidation below which the price will be able to leave the ascending channel and continue to decline to 112.50 (Murrey level [1/8]) and 100.00 (Murrey level [0/8], 38.2% Fibonacci retracement).
Technical indicators do not give a clear signal: Bollinger Bands are pointing down, Stochastic is directed up, but entered the overbought zone, which does not exclude an imminent downward reversal, the MACD is decreasing in the negative zone; however, it is worth noting that the higher timeframes confirm the preservation of a long-term uptrend (Bollinger Bands are directed up, MACD is growing in the positive zone) which increases the likelihood of continued growth.
Support and resistance
Resistance levels: 187.50, 200.00, 212.50.
Support levels: 137.50, 112.50, 100.00.

Trading tips
Long positions can be opened from the 163.00 mark with targets of 187.50, 200.00, 212.50 and stop-loss around 150.00. Implementation period: 5–7 days.
Short positions can be opened below the level of 137.50 with targets of 112.50, 100.00 and stop-loss around 151.00.


Hot
No comment on record. Start new comment.