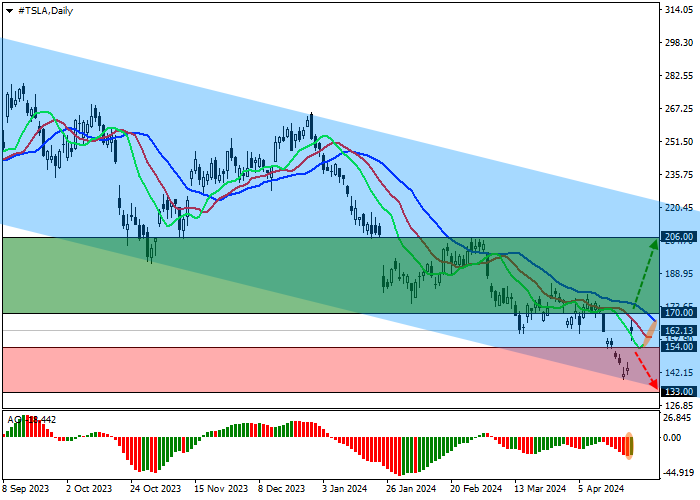
Shares of Tesla Inc., a leading manufacturer of electric cars, are trading at 162.00.
On the daily chart, the price is correcting within the downwards channel 222.00–133.00.
On the four-hour chart, it is clear that after consolidating above the high of 172.00, the quotes will reverse. On the other hand, the only obstacle to continuing the decline remains the annual low of 142.00.
Technical indicators are weakening the sell signal: fast EMA on the Alligator indicator turn in the direction of the signal line, and the AO histogram forms corrective bars in the sell zone.
Trading tips
Long positions may be opened after the price rises and consolidates above 170.00, with the target at 206.00. Stop loss – 160.00. Implementation period: 7 days or more.
Short positions may be opened after the price declines and consolidates below 154.00, with the target at 133.00. Stop loss – 160.00.
Disclaimer: The content above represents only the views of the author or guest. It does not represent any views or positions of FOLLOWME and does not mean that FOLLOWME agrees with its statement or description, nor does it constitute any investment advice. For all actions taken by visitors based on information provided by the FOLLOWME community, the community does not assume any form of liability unless otherwise expressly promised in writing.


Hot
No comment on record. Start new comment.