USD/CHF, D1
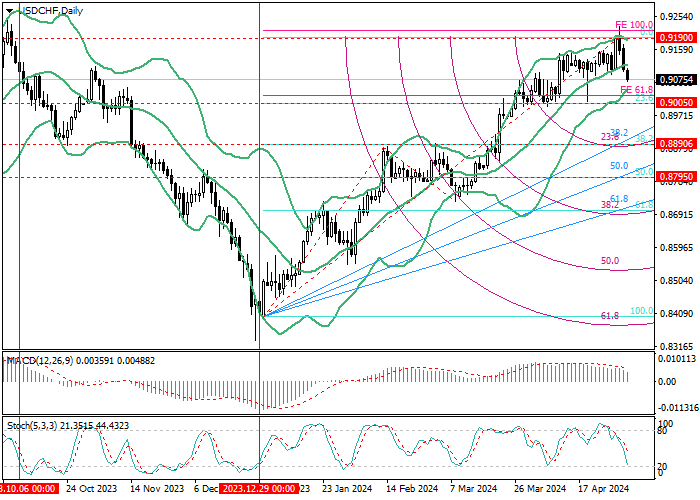
On the daily chart, the price is growing as part of the medium-term upward trend: this week, it renewed the annual high of 0.9220 and began a correction. If 0.9005 (23.6% correction) is broken, the quotes can reach the area of 0.8890 (38.2% correction) and 0.8795 (50.0% correction), for which they will need to overcome the lines of the ascending fan. A breakout of the key “bullish” level of 0.9190 (0.0% correction) will lead to growth to 0.9510 (Fibonacci extension 161.8%).
Technical indicators confirm the continuation of the upward trend: Bollinger bands are directed upwards, the MACD histogram is decreasing in the positive zone, and Stochastic is directed downward, approaching the oversold zone, which reflects the likelihood of a reversal.

USD/CHF, W1
On the weekly chart, the asset is correcting to the long-term downward trend: the quotes reversed at 0.8400 (correction 0.0%), and this week, it approached 0.9230 (correction 50.0%). Its breakout will allow the price to reach 0.9420 (correction 61.8 %), which will require breaking through the downward fan. After consolidation below 0.9035 (correction of 38.2%), the decline can continue to 0.8795 (correction of 23.6%, the middle line of Bollinger bands).
Technical indicators do not give a single signal: Bollinger bands reverse upwards, the MACD histogram is increasing in the positive zone, but Stochastic is leaving the overbought zone, which does not exclude a decline.

Support and resistance
Soon, the continued growth of the trading instrument seems more likely. After a breakout of the level 0.9230 (50.0% correction, W1), the growth targets will be 0.9420 (61.8% correction, W1) and 0.9510 (Fibonacci extension 161.8%, D1). After a breakdown of 0.9005 (23.6% correction, D1), the negative dynamics will resume to 0.8890 (38.2% correction, D1), 0.8795 (23.6% correction, the middle line of Bollinger Bands, W1, correction 50,0%, D1).
Resistance levels: 0.9230, 0.9420, 0.9510.
Support levels: 0.9005, 0.8890, 0.8795.
Trading tips
Long positions may be opened above 0.9230, with the targets at 0.9420, 0.9510, and stop loss 0.9190. Implementation time: 5–7 days.
Short positions may be opened below 0.9005, with the targets at 0.8890, 0.8795, and stop loss of 0.9090.


Hot
No comment on record. Start new comment.