BTCUSD (Bitcoin) Makes New All Time High. What's Next?

BTCUSD (Bitcoin) has been in a strong uptrend since November 2022. The previous all-time peak was seen on November 8, 2021 and was broken in March 2024 when Bitcoin made a new all-time high at 73794 on March 14, 2024. It has since seen a pull back which reached a low of 56500 on May 1, 2024 and is now turning higher again. Today, we will take a look at the bigger picture of Bitcoin, what are the upside targets and any possible detours which can take place.
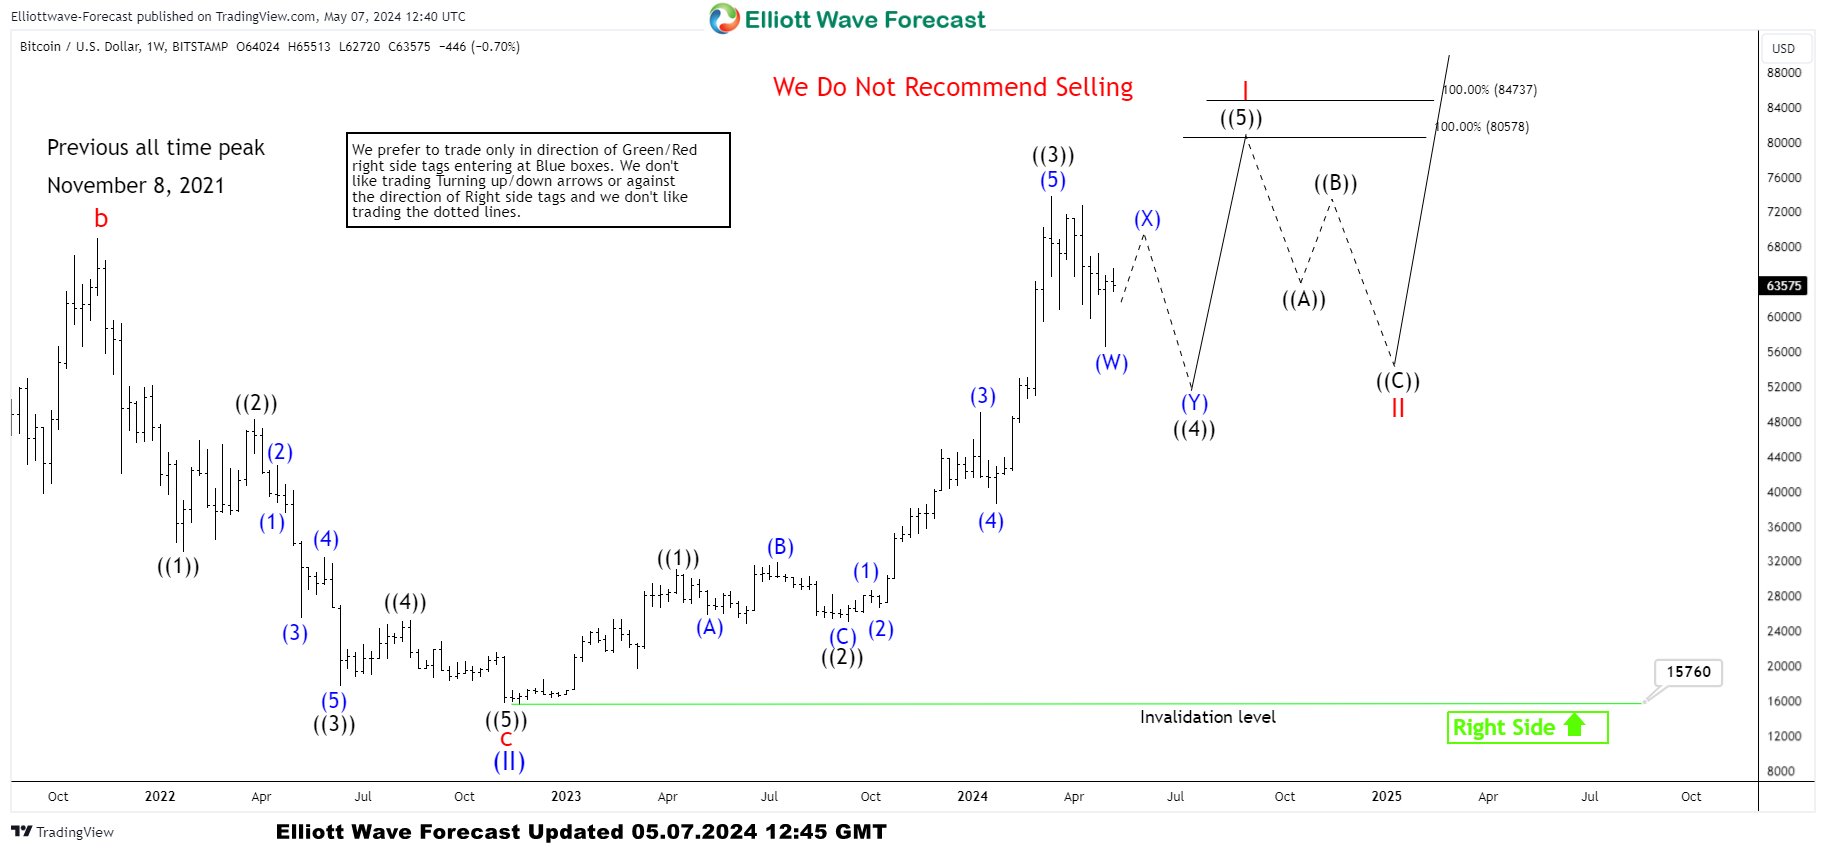
BTCUSD Weekly Elliott Wave Chart 7 May 2024
The Bitcoin chart below shows it completed an expanded FLAT correction in November 2022 and resumed the rally. Wave ((1)) ended at 31035, wave ((2)) completed at 24920 after which it resumed the rally in wave ((3)). Within wave ((3)), wave (1) competed at 49048, wave (2) completed at 38505, wave (3) ended at 73794, and wave (4) is also proposed to be over at 56500. As dips hold above this level, we are expecting a continuation higher in wave (5) of ((3)). Inverse 123.6 Fibonacci extension of wave (4) pullback comes at 77379. After a new high to complete wave ((3)), we expect another pullback in wave ((4)) to correct the cycle from September 2023 low and higher again in wave ((5)) toward 80578 - 84737 area which is 100% Fibonacci extension of the first leg up from all-time low projected higher from November 2022 low. We have two different 100% Fibonacci extension levels based on whether we count wave (I) at April 2021 or November 2021.

BTCUSD Weekly Elliott Wave Chart 7 May 2024 [Alternate View]
The Bitcoin chart below shows the possibility that wave ((3)) is already in place and we end up with a double three Elliott wave correction in wave ((4)). If we fail to break above the high at 73794 and see a break lower, that will support the alternate view. The target area on the upside remains to be between 80578 - 84737. We don't recommend selling and in case of a double correction lower and will be looking for a buying opportunity at the next extreme area in case we get a double correction lower.
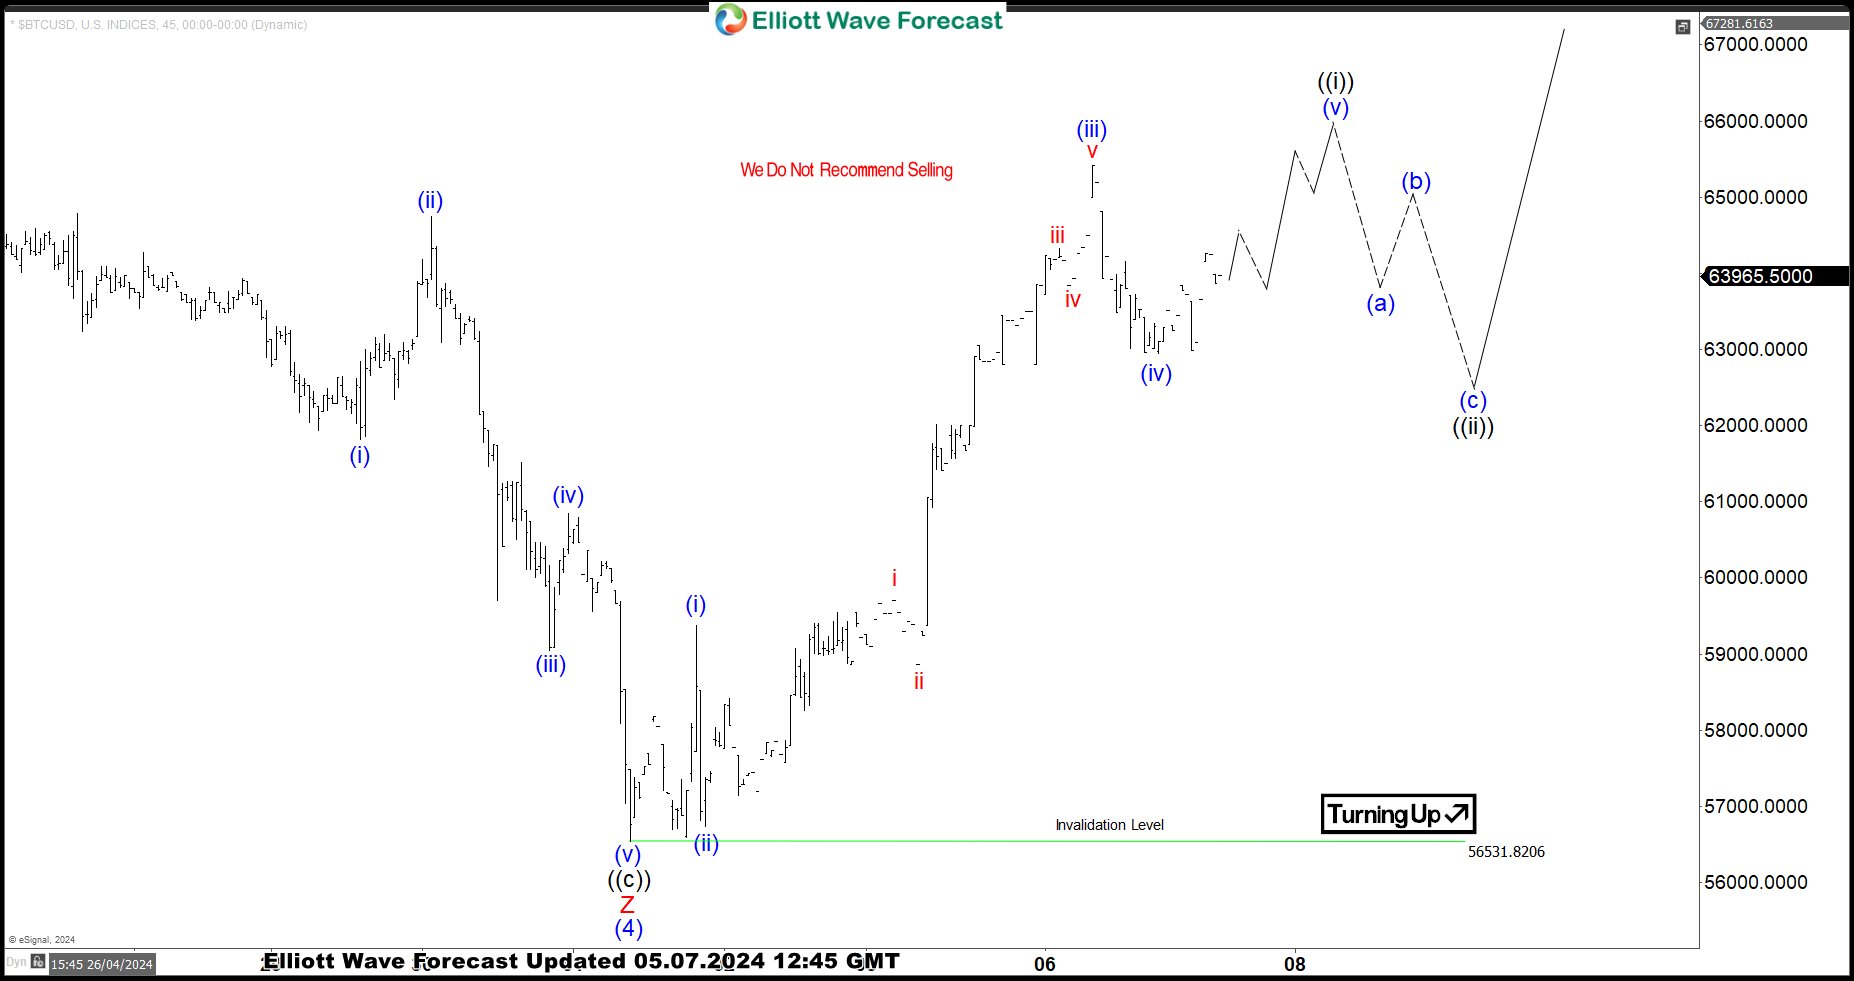
BTCUSD 1 Hour Elliott Wave Chart 7 May 2024
Bitcoin Short-term view suggests rally from May 1, 2024 is so far in 3 waves but it is extended and wave ( iii ) extended more than 261.8% Fibonacci extension of wave (i) related to wave (ii). This supports the idea that the rally should turn into an Elliott wave impulse. Once a new high has been seen, that will complete 5 waves up from the low and support the idea that pull backs should hold the low for at least 1 more leg higher.
Disclaimer: The content above represents only the views of the author or guest. It does not represent any views or positions of FOLLOWME and does not mean that FOLLOWME agrees with its statement or description, nor does it constitute any investment advice. For all actions taken by visitors based on information provided by the FOLLOWME community, the community does not assume any form of liability unless otherwise expressly promised in writing.
FOLLOWME Trading Community Website: https://www.followme.com


Hot
No comment on record. Start new comment.