移动平均震荡指标 (OsMA)

移动平均震荡指标 (OsMA) 是表示价格走势的指标。
它是通过比较较短期移动平均线和较长期移动平均线之间的差异所计算出来的。
最常见的两个是 12 周期移动平均线和 26 周期移动平均线。因此,对它最恰当的形容就是 MACD MACD修改版。
要想确定动量是倾向上涨还是倾向下跌,一个非常简单的方法就是看穿越零线或中线。操盘手会用柱形图所在的线的那一侧来帮助他们决定在市场中的买卖方向。
OsMA 本质上表示的是一个证券在何时被买空或卖空oversold,或何时有新趋势形成。
OsMA 由 MACD 计算而来
OsMA number_1 指标(由 MACD 计算得出)在下图中的标识为:

下图显示了 EUR/USD 货币对,其下方显示了 OsMA 指标。
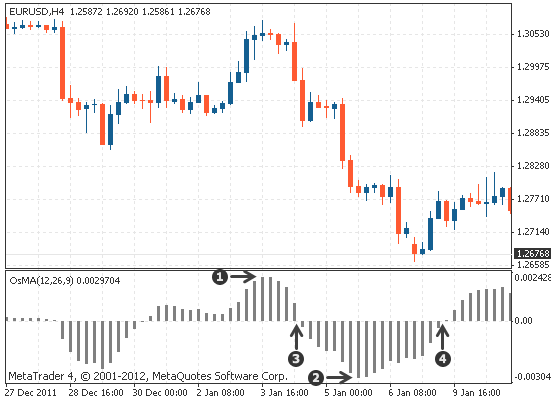
当震荡指标接近指标1 的上限时,表示该资产可能被买空。当它接近下限时,表示该资产可能被卖空2。
通常当指标由正转负时,可能意味着下降趋势开始形成 3。当指标由负转正时,意味着上升趋势可能开始形成 4。
Reprinted from 汇友网,the copyright all reserved by the original author.
Disclaimer: The content above represents only the views of the author or guest. It does not represent any views or positions of FOLLOWME and does not mean that FOLLOWME agrees with its statement or description, nor does it constitute any investment advice. For all actions taken by visitors based on information provided by the FOLLOWME community, the community does not assume any form of liability unless otherwise expressly promised in writing.
FOLLOWME Trading Community Website: https://www.followme.com


Hot
-THE END-