NZD/USD technical analysis: Bulls take a breather near 200-DMA/50% Fibo. confluence region

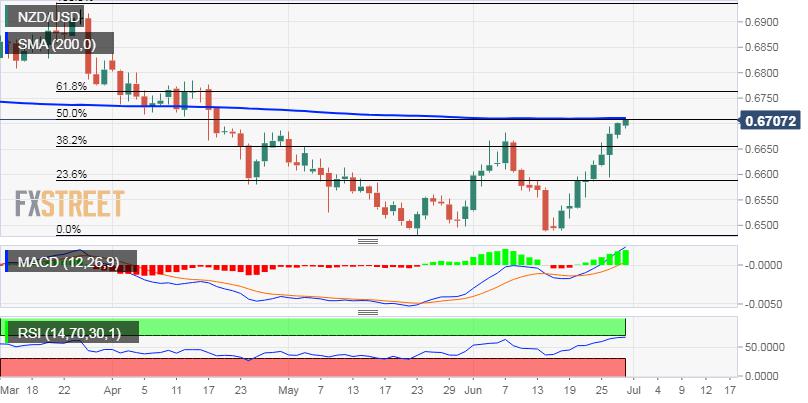
- The NZD/USD pair extended its recent bullish trajectory further beyond the 0.6700 handle, hitting over two-month tops on the last trading day of the week.
- Meanwhile, bulls took a brief pause near a confluence region - comprising of the very important 200-day SMA and 50% Fibo. level of the 0.6939-0.6481 downfall.
A follow-through buying will confirm a fresh bullish break-out and set the stage for an extension of the recent appreciating move, though traders are likely to wait for the outcome of the US President Donald Trump’s meeting with his Chinese counterpart Xi Jinping.
Momentum beyond the mentioned barrier has the potential to accelerate the up-move towards the 0.6765-70 supply zone (61.8% Fibo. level), before the pair darts towards reclaiming the 0.6800 handle en-route April swing highs, around the 0.683540 region.
Meanwhile, rejection slide from the current resistance zone now seems to find decent support near 38.2% Fibo. level – around the 0.6660-55 region, which if broken might turn the pair vulnerable to aim towards challenging the 0.6600 round figure mark.
NZD/USD daily chart
Reprinted from FXStreet,the copyright all reserved by the original author.
Disclaimer: The content above represents only the views of the author or guest. It does not represent any views or positions of FOLLOWME and does not mean that FOLLOWME agrees with its statement or description, nor does it constitute any investment advice. For all actions taken by visitors based on information provided by the FOLLOWME community, the community does not assume any form of liability unless otherwise expressly promised in writing.
FOLLOWME Trading Community Website: https://www.followme.com


Hot
-THE END-