Safe haven bias remains, but are there signs of stability forming?

Market Overview
The degree of panic that had been spreading throughout major markets in the earlier part of the week has begun to show signs of stabilisation. Treasury yields which had spiked lower seem to be consolidating, as the 10 year yield hovers around 1.70%. It would seem that traders are now becoming more accustomed to shock of Dollar/Yuan trading above 7.00. The daily fixing from the PBoC has now been above 7.00 for the past few days but was again today lower than the market had been anticipating (at 7.0136 versus an expectation of 7.0222). There is still a safe haven bias in markets with gold holding gains above $1500 (although there are signs of a consolidation) and the yen still strong below 106 versus the dollar. However there is also less indiscriminate selling across the higher risk commodity currencies for now. The key for risk appetite to sustainably improve would now be for yields to continue to stabilise and start to track back higher. We have seen Wall Street rebounding and the VIX falling sharply in the past couple of sessions. US futures are back lower again today and this will be a test of whether this opens the door to renewed selling, or there is more of an appetite to buy. Our chart of the day, Aussie/Yen tends to be a decent indicator of risk appetite and has been showing good signs of stability in recent sessions.

Wall Street closed with strong recovery gains yesterday as the S&P 500 bounced by +1.9% to 2938, but the bulls are being tested again this morning with early US futures showing a -0.5% decline. Asian markets were mixed the Nikkei +0.4% whilst the Shanghai Composite was -0.7%. In Europe there is a cautious start to trading, with both FTSE futures and DAX futures a shade lower at -0.1%. In forex, there is a minor USD slip across the majors, with JPY performing well still but also an improvement in the commodity currencies too with AUD and NZD rebounding. In commodities the gold price remains above $1500, whilst oil has started the day steady.
There is a UK focus on the economic calendar today. The prelim reading of Q2 UK GDP is at 0930BST with the market expecting zero growth for the quarter (Q1 final reading was +0.3%). Traders will also be looking out for the UK Trade Balance for June which is expected to slip further into a deficit of -£11.8bn (back from -£11.5bn in May). Also the UK Industrial Production for June is expected to have deteriorated to -0.2% for the 12 month period (down from +0.9% in May). Factory gate inflation for the US PPI is at 1330BST and is expected to remain at +1.7% for the headline PPI in July (+1.7% in June), whilst core PPI is expected to tick slightly higher to +2.4% (from +2.3% in June).
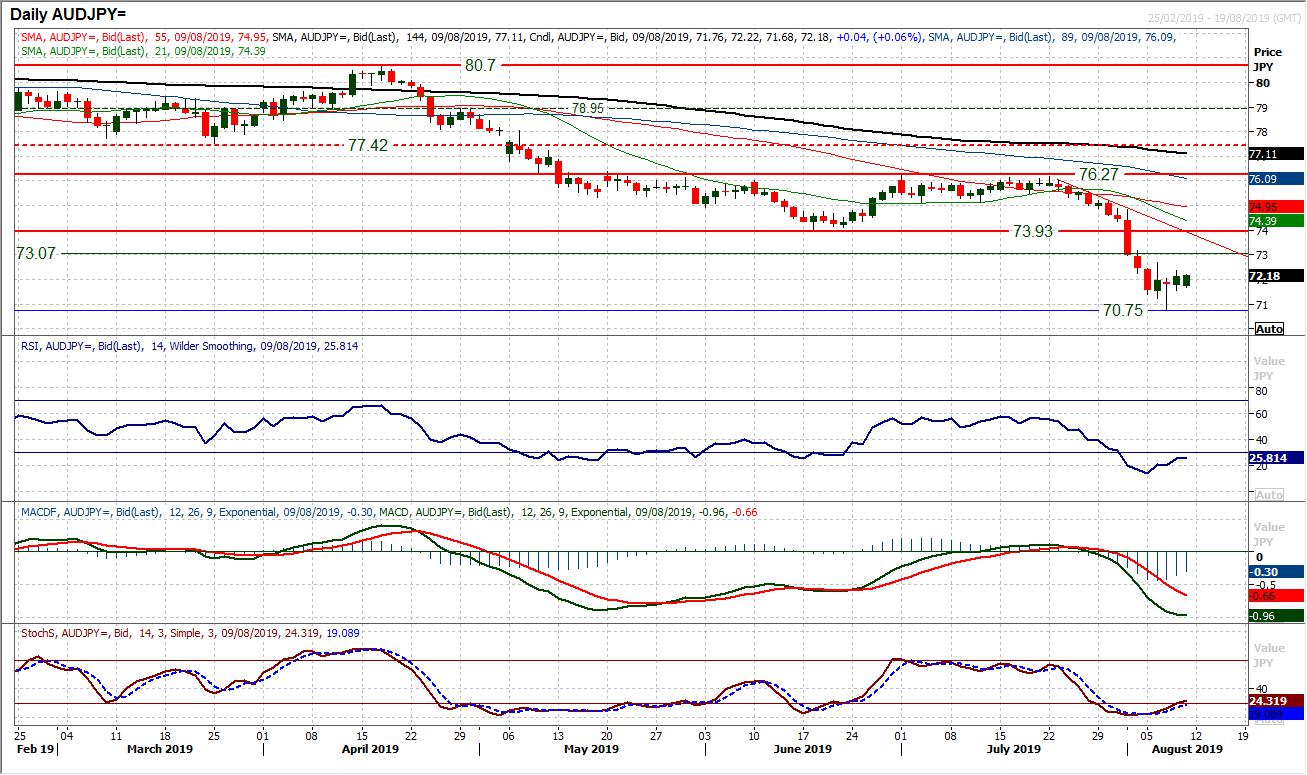
Chart of the Day – AUD/JPY
We continue to hold a strong medium to longer term yen outlook, but there are signs that a near term retracement of some of the recent strength could be showing against the Aussie. After a run accelerated lower in recent weeks, AUD/JPY is beginning to form a series of positive candlesticks, which imply a potential rebound looking to form. Wednesday’s rally into the close all but formed a bull hammer candlestick and with bull confirmation yesterday, the market is edging back higher. Seemingly intraday weakness is being bought into again this morning. There is room for a retracement but momentum indicators still have plenty to do to convince. There are buy signals hinting but still unconfirmed, with the RSI and Stochastics ticking higher. The bulls will be looking for a close above initial resistance at 72.68 to suggest a rally is really gathering momentum. If this can be seen, then there is plenty of room to run for a bounce into 73.93 which is the resistance of the old June low. Ultimately, we would continue to see the yen as a long term outperformer on forex majors and especially against the Aussie. Any failing technical rally is a chance to sell, with initial support at 71.60 needing to hold now otherwise the market will slip back towards 70.75 again.
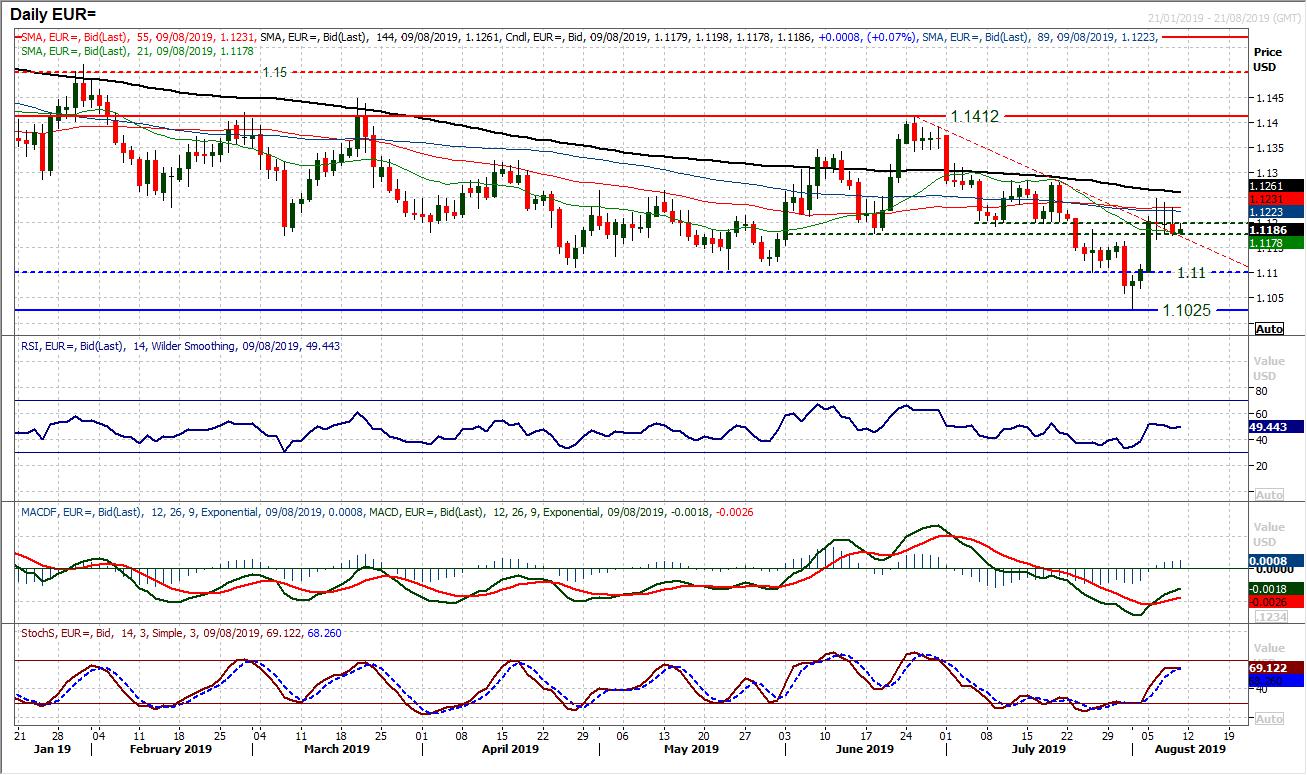
EUR/USD
We have been discussing the near to medium term importance of the pivot band between $1.1180/$1.1200 and essentially, this is an area where the market has been testing for the past few sessions. A crossroads is still to be negotiated. With the recovery from $1.1025 the outlook for EUR/USD has been made far more uncertain. The bear trend has been broken and momentum indicators are reflecting a mixed outlook now. A decisive close back under $1.1180 would lend a negative bias once more to the pair, but we no longer see it as outfight bearish. A period of choppy trading is likely in the weeks and months ahead where uncertain trends develop. The resistance overhead is still restricting a decisive recovery, with $1.1250 and a series of falling daily highs throughout this week (yesterday’s high of $1.1230 adding to resistance). The hourly chart has a very mild negative bias within a neutral configuration as the next catalyst is searched.
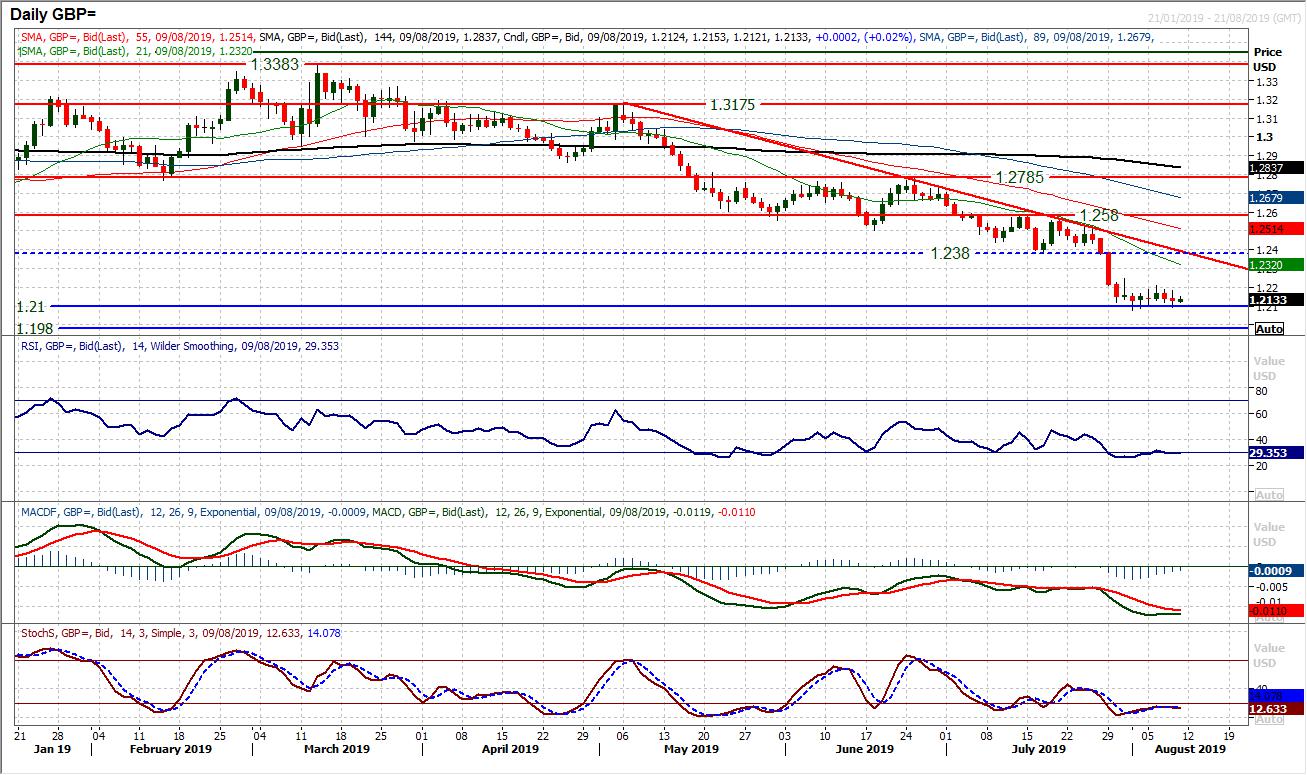
GBP/USD
The floor around $1.2100 continues to build, however, there is a lack of any real buying pressure that means the market just cannot get any decisive recovery momentum. Cable has become almost entirely devoid of any direction over the past couple of weeks. Momentum indicators have become marooned. Although there is clearly an ongoing negative configuration across the board, it seems as though all of the air has been let out of the market which had been previously so volatile. Resistance is at $1.2210 initially, with $1.2250 the main barrier to recovery. However, buyers are intent on supporting around $1.2100, with this again a feature of yesterday’s session. A close below $1.2100 would open $1.1980. A market in need of another catalyst.
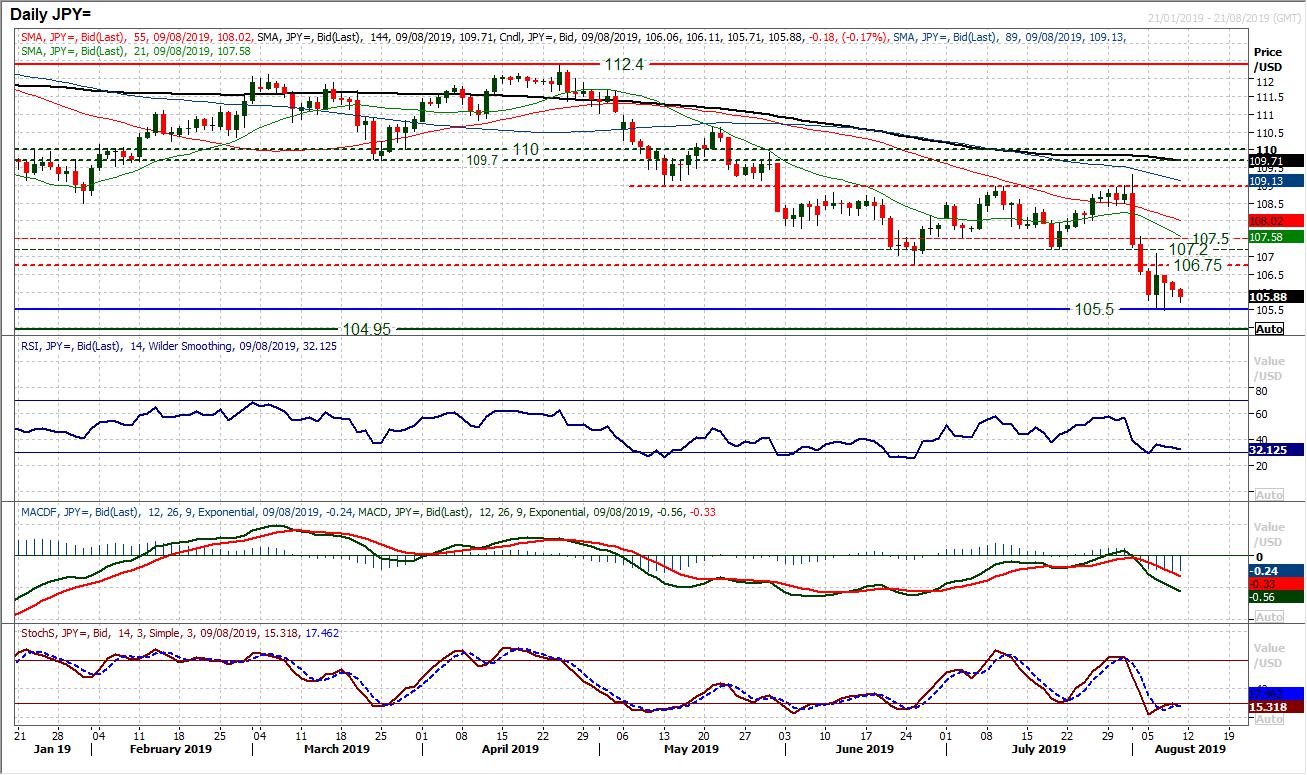
USD/JPY
The bulls continue to struggle as the market has closed lower again over the past two sessions. The prospects of a sustainable rebound that were posited with Tuesday’s bull candle have been dealt a blow as the overhead supply between 106.75/107.50 has driven the market back lower again. The momentum indicators are showing little sign of any recovery as the MACD lines continue to fall, Stochastics stutter under 20 and RSI drops away again. The pressure back on 105.50 is growing, whilst a closing break opens weakness to test 104.50/105.00 which is a long term support band. We continue to use intraday rallies as a chance to sell. This is reflected on the hourly chart with negative configuration across momentum indicators. Initial resistance at 106.30.
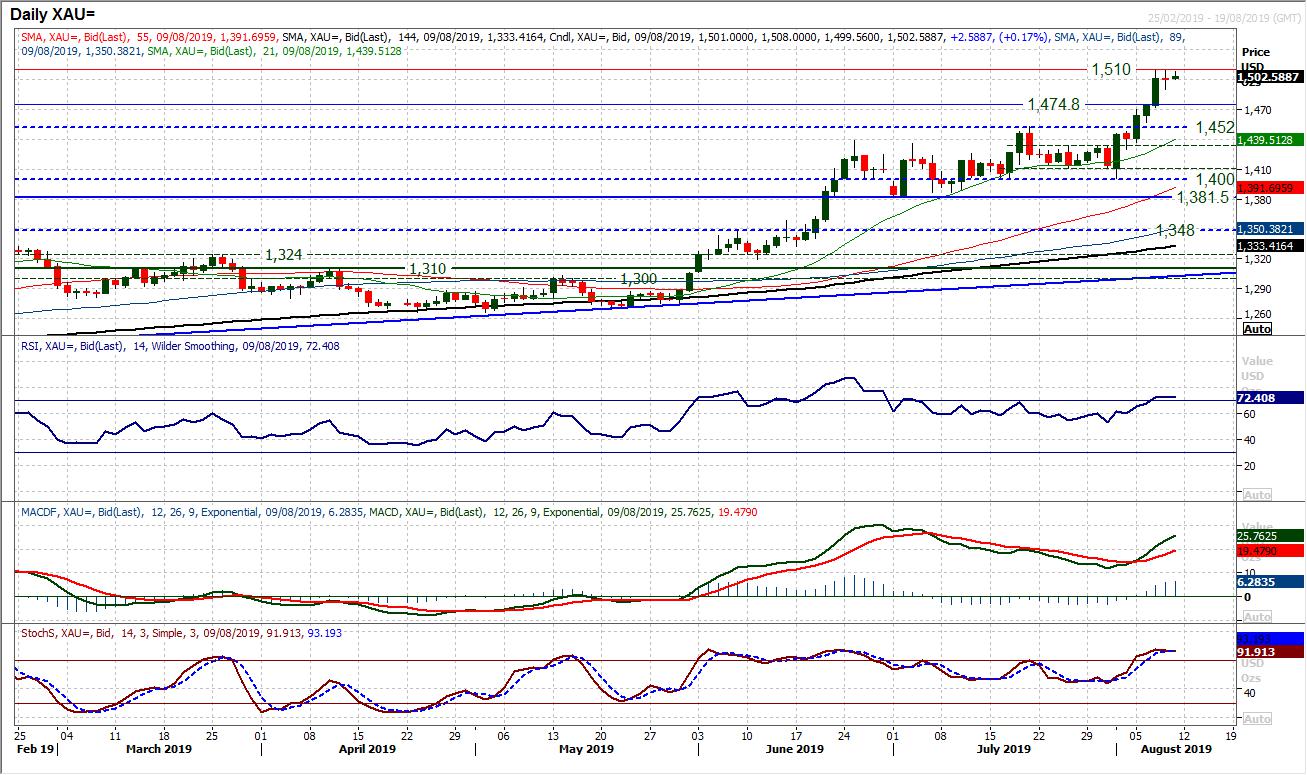
Gold
Gold remains strong after a huge run higher throughout the past week. However, there are just a few signs of slowing momentum which could induce at least some consolidation and perhaps some profit taking to develop. The run above $1500 has closed pretty much bang on $1500 for the past couple of sessions. A run of strong bull candles has also been met with a very mild negatively configured “spinning top” candlestick for yesterday’s session. This is a candle that lacks conviction and suggests a degree of uncertainty in the immediate prospects of the bull run. The RSI is just slowing above 70, whilst the Stochastics are also losing their momentum too. A tick back higher today suggests there are still buyers willing to push the market higher, but a close back under $1500 would now be a warning sign. Watch the hourly chart for MACD lines falling below neutral along with hourly RSI below 45. Resistance has built at $1510 over the past couple of sessions and again is a feature early today. Although the market is still holding up well, we are increasingly cautious of the breakout and care needs to be taken on long positions now.
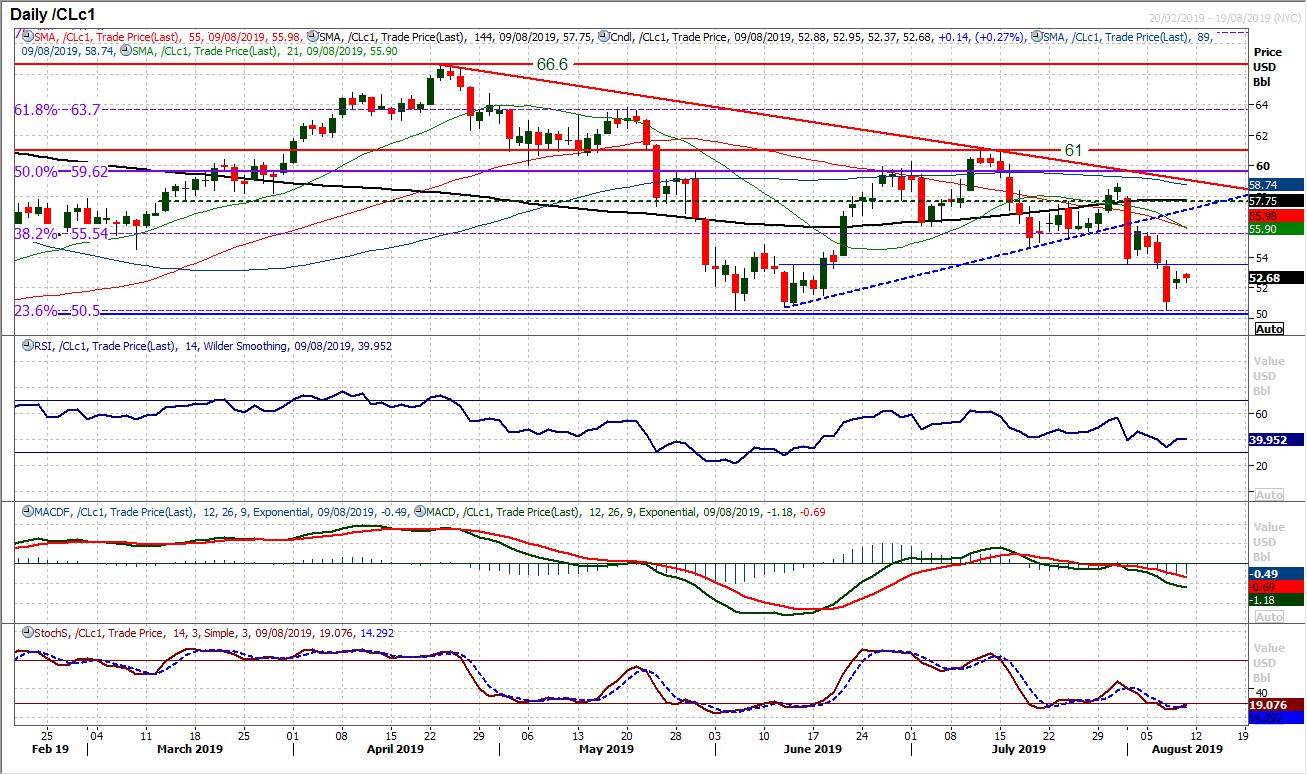
WTI Oil
After another sharp sell-off on Wednesday, was followed by a subsequent rally but given eh ongoing corrective outlook, this gives another opportunity to sell. The old support at $53.60 is an area of overhead supply and resistance for yesterday’s strong bounce. Although the market was strongly higher yesterday (by +2.8%) the candlestick lacked real conviction. An early move higher today is again struggling for traction. The market has been consistently failing at lower levels in recent weeks, with bearish configuration across momentum which suggests rallies are a chance to sell. Another failure in the $53.60/$54.70 resistance band would be an opportunity. A move back under initial support at $51.95 would re-open the low at $50.50 and a retest of the 23.6% Fibonacci retracement.
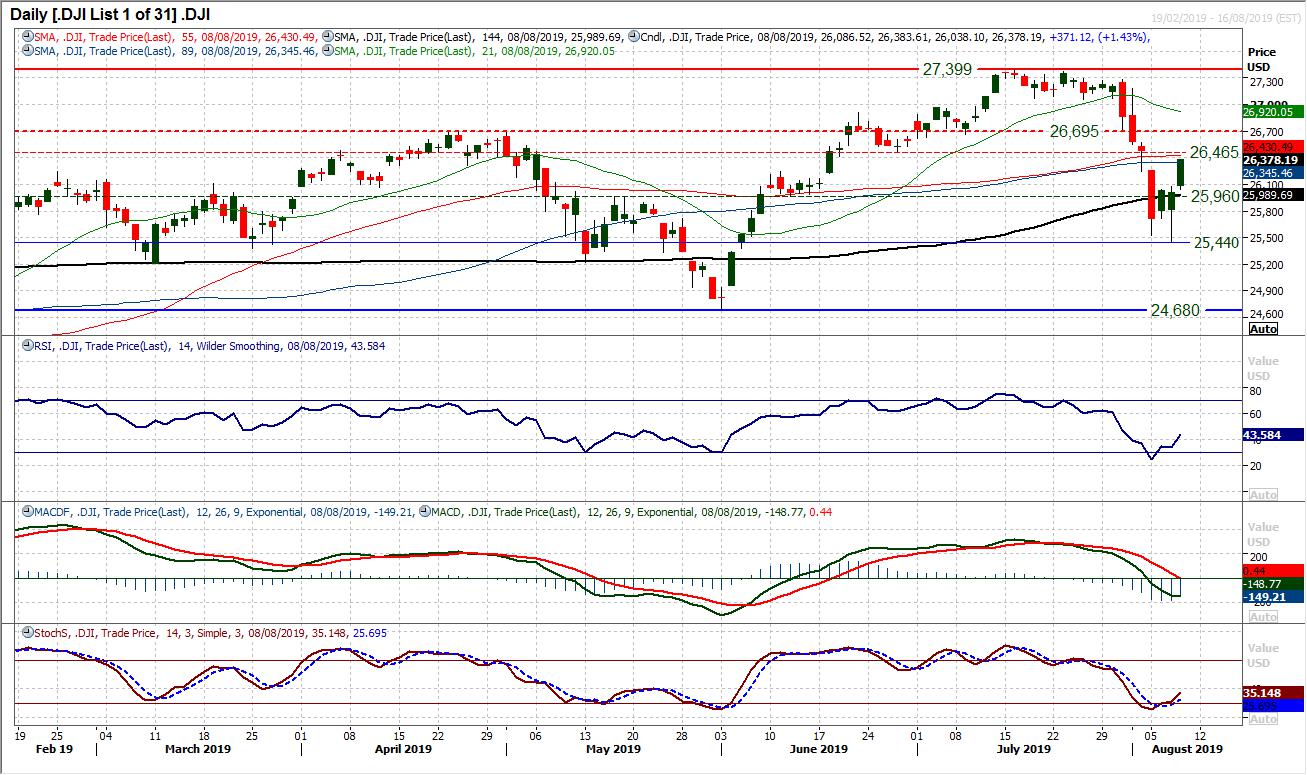
Dow Jones Industrial Average
It seems as though the bulls have found a foothold in the market once more. A couple of bottoming candles to lay the foundations of support at 25,440 have been followed by a solidly strong positive session yesterday. This move has now pulled the market up for what is the first real test of the recovery. The resistance of the old lows at 26,465/26,695 where there is a band of 230 pips of overhead supply. There is a technical rally underway with the momentum indicators ticking higher (a bull cross on Stochastics is the most encouraging aspect of this). However, the bulls need to now decisively break through this overhead supply. The hourly chart shows initial support around 26,030 with an old pivot on the daily chart at 25,960. Another intraday higher low around here would serve the bulls well for their rebound. Futures are a shade lower today so again reaction around this support will be important for the prospective recovery.
Reprinted from FXStreet,the copyright all reserved by the original author.
Disclaimer: The content above represents only the views of the author or guest. It does not represent any views or positions of FOLLOWME and does not mean that FOLLOWME agrees with its statement or description, nor does it constitute any investment advice. For all actions taken by visitors based on information provided by the FOLLOWME community, the community does not assume any form of liability unless otherwise expressly promised in writing.
FOLLOWME Trading Community Website: https://www.followme.com


Hot
No comment on record. Start new comment.