UK Oil EMAs Cross Bearishly On H1 Chart

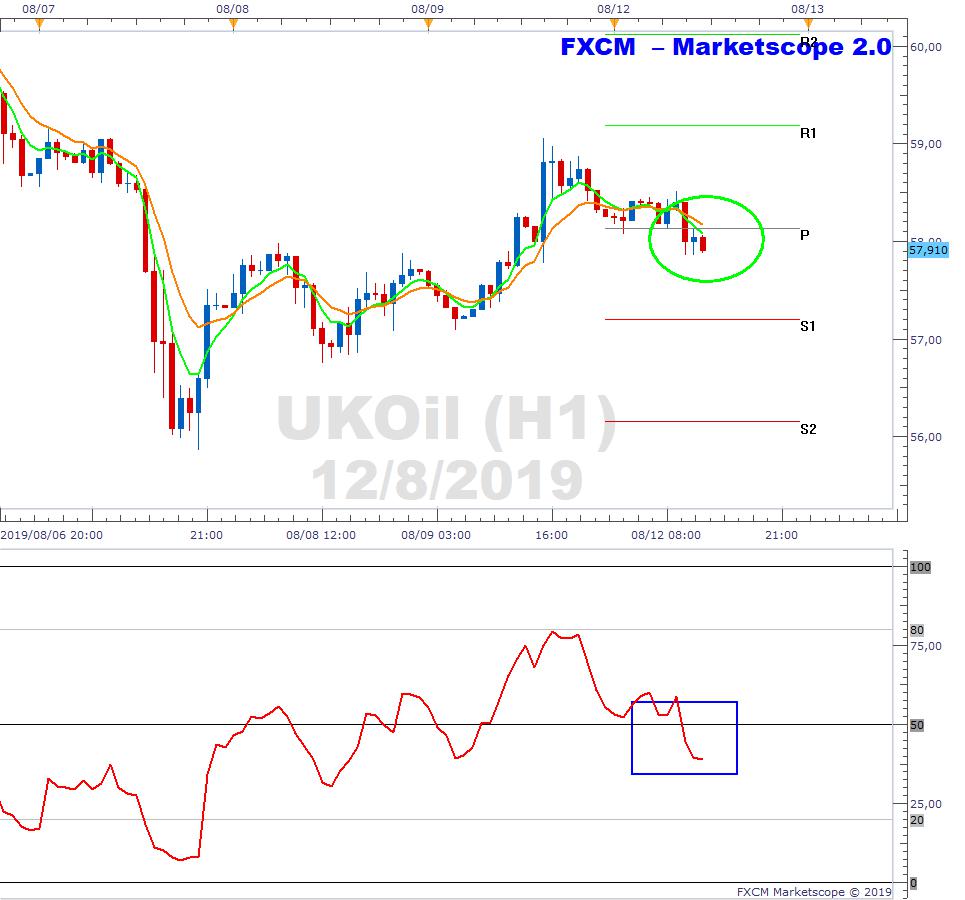
The below is the hourly chart of UKOil. The green 5-hour EMA has crossed below the orange 10-hour EMA (green ellipse) and the RSI has moved below 50 (blue rectangle). This is due to worries about a slowing in the global economy and the escalation in the US/China trade war, which has impacted on crude demand. If the EMAs develop further angle and separation it will likely be a signal of lower prices. We continue to monitor.
Past performance is not an indicator of future results.
CHART SOURCE: FXCM MARKETSCOPE 2.0
Reprinted from FXStreet,the copyright all reserved by the original author.
Disclaimer: The content above represents only the views of the author or guest. It does not represent any views or positions of FOLLOWME and does not mean that FOLLOWME agrees with its statement or description, nor does it constitute any investment advice. For all actions taken by visitors based on information provided by the FOLLOWME community, the community does not assume any form of liability unless otherwise expressly promised in writing.
FOLLOWME Trading Community Website: https://www.followme.com


Hot
No comment on record. Start new comment.