Gold technical analysis: Trapped in a symmetrical triangle

- Gold has charted lower highs and higher lows or a symmetrical triangle on the 4-hour chart.
- A triangle breakdown looks likely and could fuel a drop to $1,380.
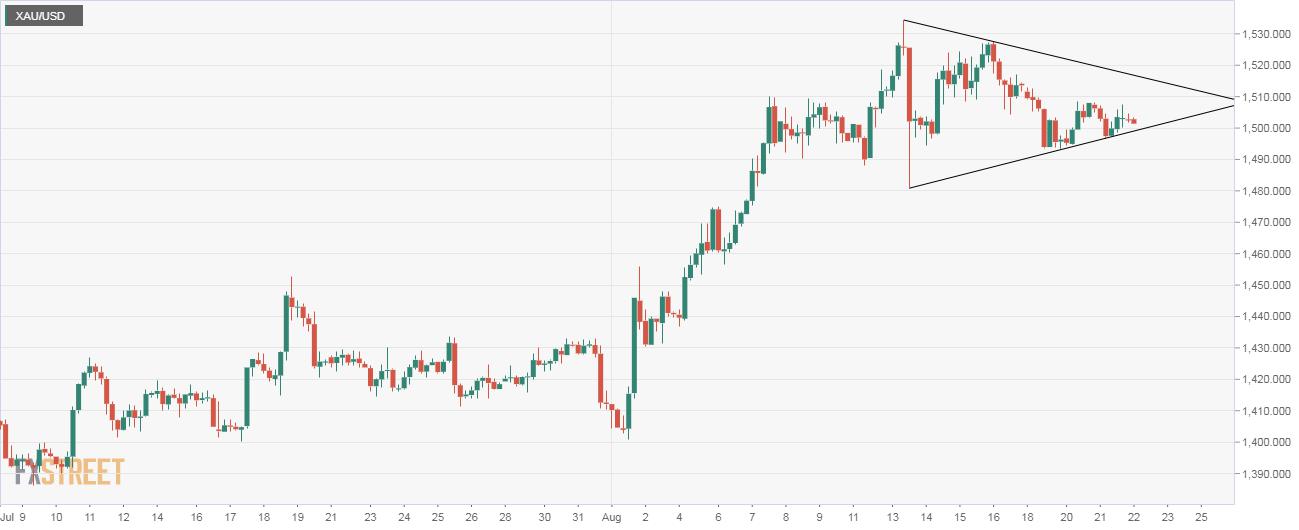
Gold is trapped in a narrowing price or a symmetrical triangle pattern, according to the 4-hour chart.
The yellow metal rose to a six-year high of $1,353 per Oz on Aug. 13 and has charted lower highs and higher lows ever since.
A triangle breakdown would mean a temporary top has been made and could yield a drop to $1,380 (Aug. 13 low). A violation there would expose the former resistance-turned-support at $1,453.
As of writing, Gold is trading largely unchanged on the day at $1,502 and the lower edge of the symmetrical triangle is seen at $1,398.
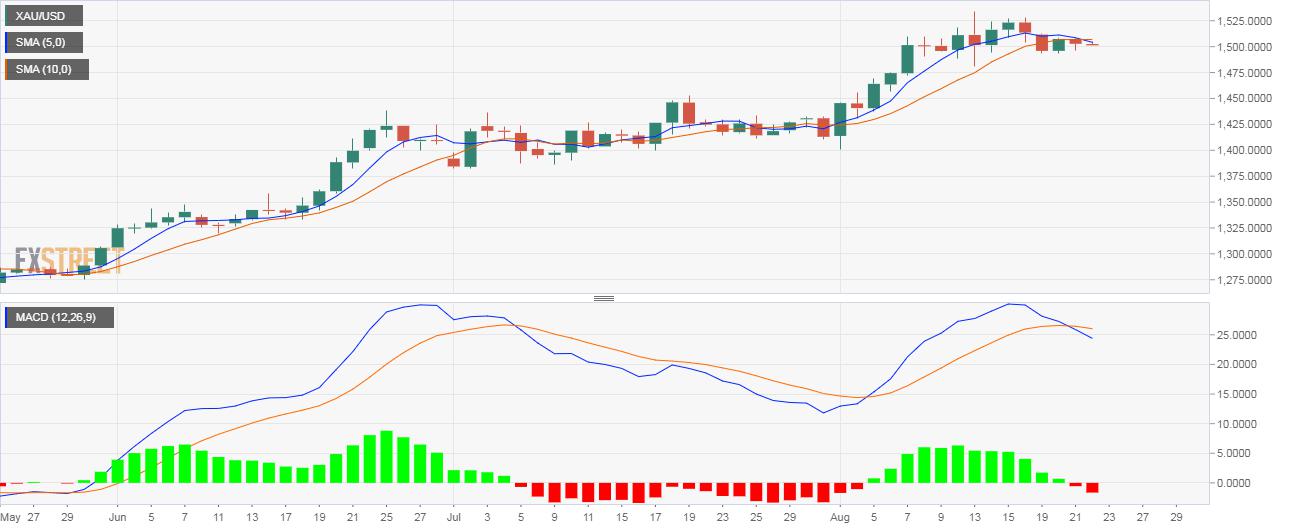
The recent high of $1,353 could come into play if the symmetrical triangle ends with a bullish breakout, although, as of now, the probability of Gold breaking lower appears high, courtesy of the bearish crossover of the 5- and 10-day MAs and the daily moving average convergence divergence (MACD) histogram's drop below zero.
4-hour chart
Daily chart
Trend: Cautiously bearish
Pivot points
Reprinted from FXStreet,the copyright all reserved by the original author.
Disclaimer: The content above represents only the views of the author or guest. It does not represent any views or positions of FOLLOWME and does not mean that FOLLOWME agrees with its statement or description, nor does it constitute any investment advice. For all actions taken by visitors based on information provided by the FOLLOWME community, the community does not assume any form of liability unless otherwise expressly promised in writing.
FOLLOWME Trading Community Website: https://www.followme.com


Hot
No comment on record. Start new comment.