Gold technical analysis: Pivots around $1500 mark, below 200-hour SMA

- Gold has been pivoting around the key $1500 psychological mark over the past two trading sessions and remained confined in a narrow trading band through the early European session on Thursday.
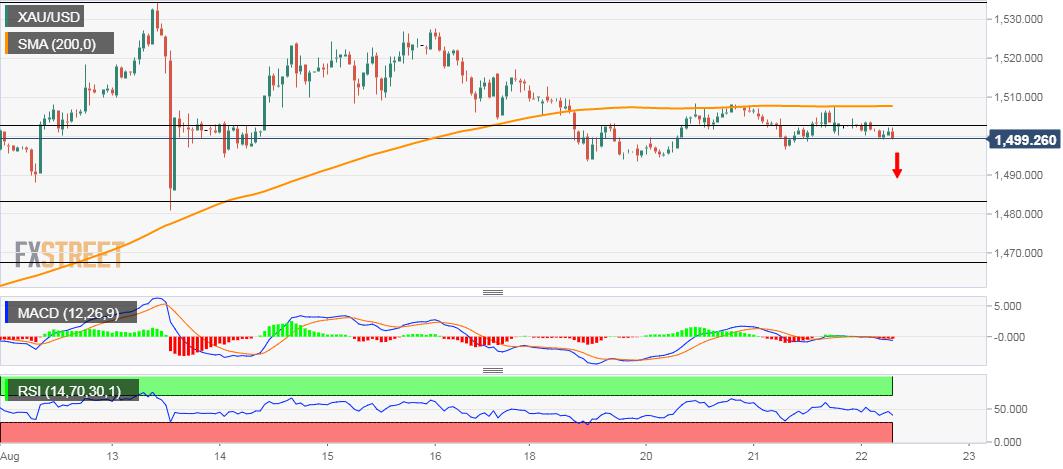
- The commodity has already found acceptance below 200-hour SMA and has been consolidating around 23.6% Fibonacci retracement level of the $1400-$1535 recent upsurge to multi-year tops.
Meanwhile, technical indicators on hourly charts have been drifting lower in the negative territory and now seemed to support prospects for an extension of the corrective slide back towards testing last week's swing lows - around the $1483-81 region - also nearing 38.2% Fibo. level.
However, oscillators on the daily chart have still managed to maintain their bullish bias and should continue to attract some dip-buying interest at lower levels, which might help limit further downside ahead of the Fed Chair Jerome Powell's scheduled speech at Jackson Hole on Friday.
Should bulls fail to defend the mentioned support, some follow-through selling might turn the precious metal to accelerate the slide further towards $1475 level en-route 50% Fibo. level near the $1467-65 zone and a previous resistance breakpoint turned support near the $1450 region.
On the flip side, 200-hour SMA - currently near the $1507 region now seems to act as an immediate resistance, which if cleared decisively might trigger a fresh leg of an up-move and lift the yellow metal back towards $1522 intermediate resistance ahead of multi-year tops.
Gold 1-hourly chart
Reprinted from FXStreet,the copyright all reserved by the original author.
Disclaimer: The content above represents only the views of the author or guest. It does not represent any views or positions of FOLLOWME and does not mean that FOLLOWME agrees with its statement or description, nor does it constitute any investment advice. For all actions taken by visitors based on information provided by the FOLLOWME community, the community does not assume any form of liability unless otherwise expressly promised in writing.
FOLLOWME Trading Community Website: https://www.followme.com


Hot
No comment on record. Start new comment.