Is the Bear Growling?

Market Overview
Since its initial drop of 200 points in late July, SPX has attempted two rallies of over 100-points each. Both failed miserably with prices being shoved back down to the bottom of the large congestion band which has formed above 2820. On Friday, SPX again reached 2835 minutes before the close, and started to rebound. There was some follow-through in the futures, but don’t expect another hundred point rally because it will likely not take place. This time, we should be looking lower -- perhaps much lower over the next few months. Maybe a return down to the December ’18 low, and perhaps even lower! But the odds of this being the beginning of a bear market are still slim. Most likely, it will turn out to be the last large correction in the bull market which started in 2009, and which is already one of the longest in history.
All market fluctuations,large and small, are caused by natural cycles which are continually in play in the universe and affect everything within it. If cycle analysts are correct, the immediate future is going to be bumpy for the stock market because of the cycles that will influence it well into next year. This is one of the reasons why I have been predicting an intermediate downtrend to take hold and to continue over the next few months.
Market Analysis (The following charts are courtesy of QChart)
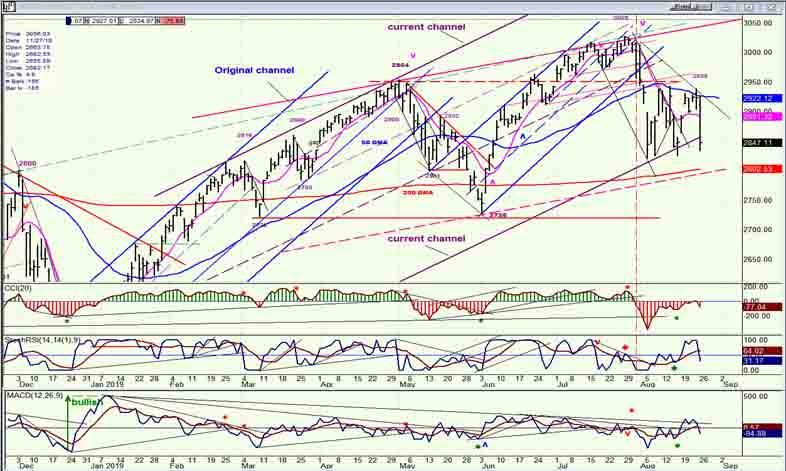
SPX daily chart
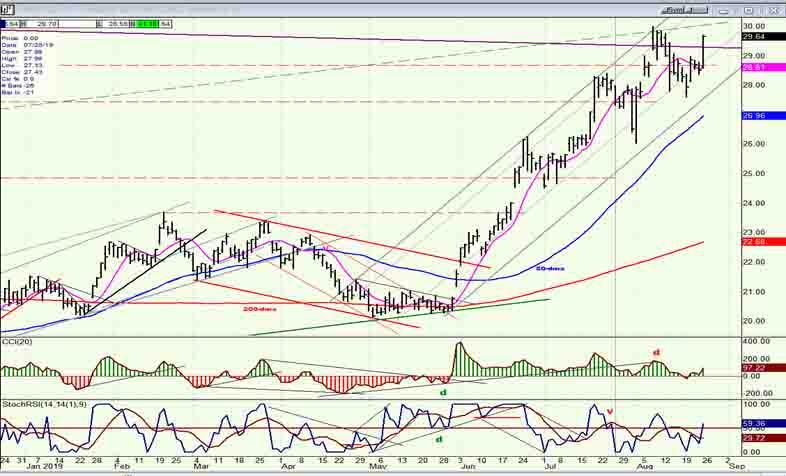
For some time I have been calling attention to the large purplechannel which continues to keep rising prices within its confines. This is about to end! There have been three probes to the lower channel line since early August, with the last one occurring this past Friday. This one also marks the first close outside the line. Although it is expected to hold for another day or two, it is doomed to be decisively penetrated on the downside as the downtrend resumes after a brief respite. The next temporary level of support will probably be the 2800 level, where the dashed parallel to the new red channel line drawn across the tops meets the 200-dma. A longer pause should take hold there as the first wave of the new decline comes to an end, and aminor rally keeps prices in a consolidation phase before a more vigorous declinecontinues the downtrend which started from the 3028 level.
The two lowest oscillators tend to move in tandem, although the top one is strictly price-related and the bottom one is based on breadth. All three oscillators gave a sell signal when the index first started its decline from 3058, but the multiple rebound off the channel line failed to move the top one back into the green and, after Friday’s decline, all three have become negative once again, suggesting that another period of weakness is taking hold.
Perhaps most importantly, as of Friday the weekly indicators have now given a confirmed sell signal.
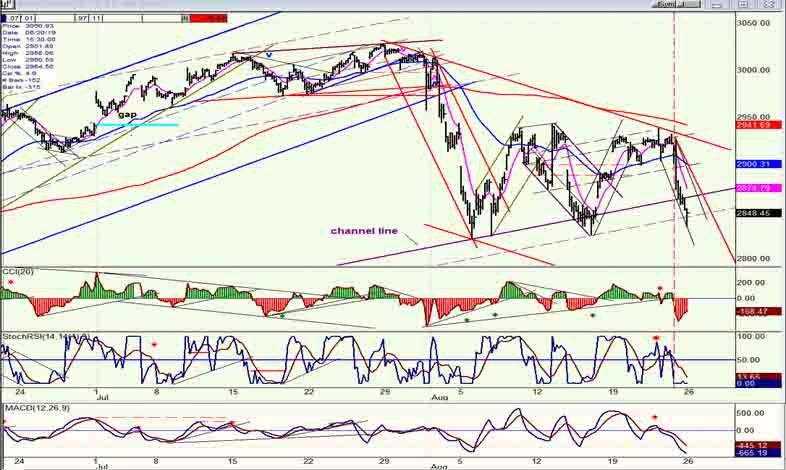
SPX hourly chart
The red trend line which I have drawn connecting the top with last Thursday’s high and its parallel drawn at the early August low,form a bearish channel which gives us an idea of the path that prices are beginning to take. There should be a little extension of Friday’s last minute rally before we continuedown to about 2800;a larger rebound from there, and then more downtrend. It’s possible that we may not get any meaningful counter-trend rallies until we get to the low of the 40-wk cycle which is due about mid-September. By then, if the bottoming cycle is as potent as it was when it created the December ’18 low, we could be down to about 2550 -- the potential count which has been created in the Point & Figure chart pattern. This should be followed by a good counter-trend move, but it is not likely to be the end of the entire intermediate correction.
The larger top from which we can derive the extent of the entire decline will only be complete when we have broken below 2740. All the distribution which has taken place above 2740 should then give us a good idea of how far down this correction can drive the SPX, and 2100-2200 may not be far-fetched. Even so if, as skilled EWT analysts believe, what we are doing is only the beginning (or completion)of wave 4, we have notyet exhausted the total potential of this bull market.
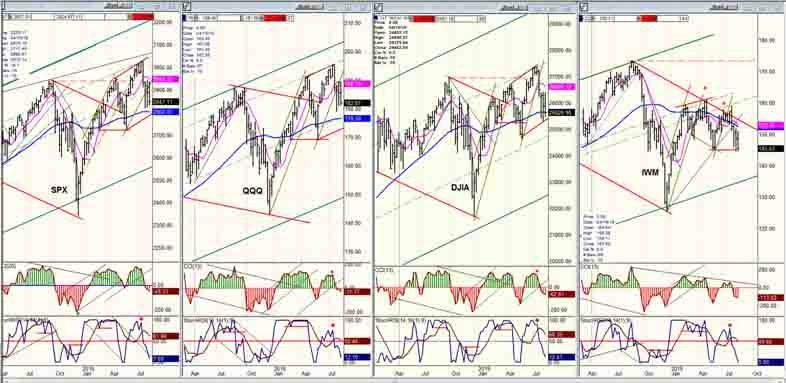
QQQ, SPX, DJIA, IWM (weekly)
As I mentioned earlier, I believe that we now have a confirmed sell signal at the weekly level. From an oscillator perspective, we are probably in a position similar to where we were in October of last year, although considering only our relationship to the next 40-wk cycle low, it looks more like where we were at the beginning of December. In either case, we are facing a sharp decline over the next few weeks;the main difference being that this time, it is not likely that the entire correction will end with the bottoming of the 40-wk cycle but that, after a rally, the correction will have a good chance of continuing into next year.
IWM is still leading to the downside. It is already challenging its May low, while the others are still well above it. Considering what probably lies ahead, it’s very possible that IWM is facing a decline of another 70 points before this correction is over.
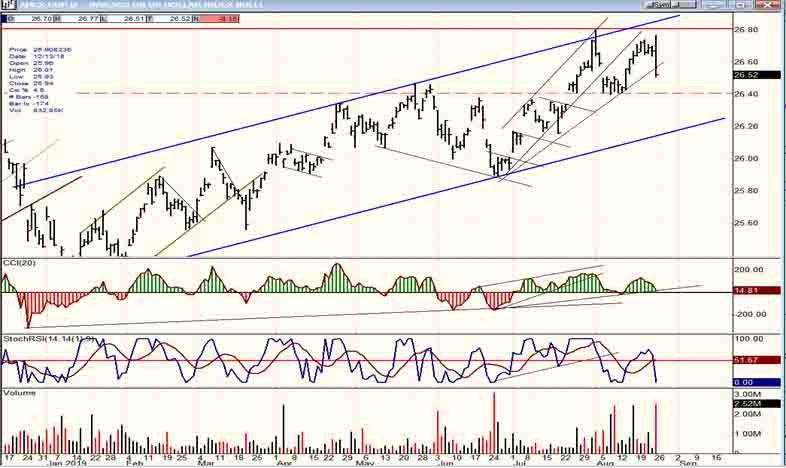
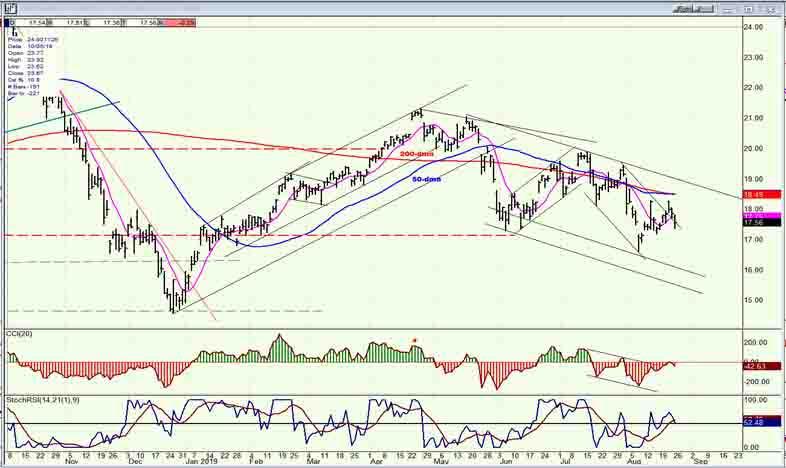
UUP (dollar ETF) daily
UUP had a significant drop on very heavy volume which suggests an important reversal may have occurred, but since we did not get a sell confirmation at the indicators level, we’ll need to see a little more weakness.
GDX (Gold miners ETF) weekly
GDX reacted positively to UUP’s weakness, but it fell short of giving a confirmed buy signal. Let’s see if it can take that little extra step in the next couple of days.
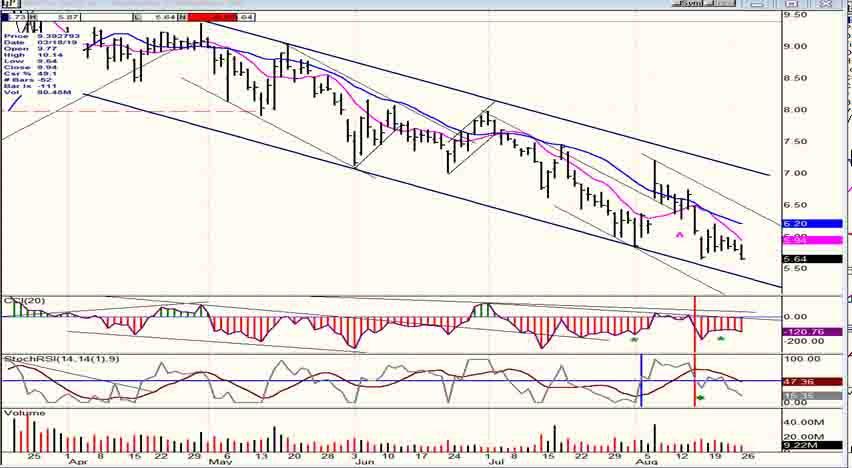
ACB (Aurora Cannabis) daily
ACB looks as if it has a little more to go before it is in a position to start forming a base.
BNO (U.S. Brent oil fund) daily
BNO also reversed on Friday and should continue to move in concert with the market.
Summary
Friday’s sharp decline has probably ended SPX’s 3-week consolidation and the index should be about to extend the intermediate decline which started at 3028. We should have a confirmation of this by the end of next week.
Reprinted from FXStreet,the copyright all reserved by the original author.
Disclaimer: The content above represents only the views of the author or guest. It does not represent any views or positions of FOLLOWME and does not mean that FOLLOWME agrees with its statement or description, nor does it constitute any investment advice. For all actions taken by visitors based on information provided by the FOLLOWME community, the community does not assume any form of liability unless otherwise expressly promised in writing.
FOLLOWME Trading Community Website: https://www.followme.com


Hot
No comment on record. Start new comment.