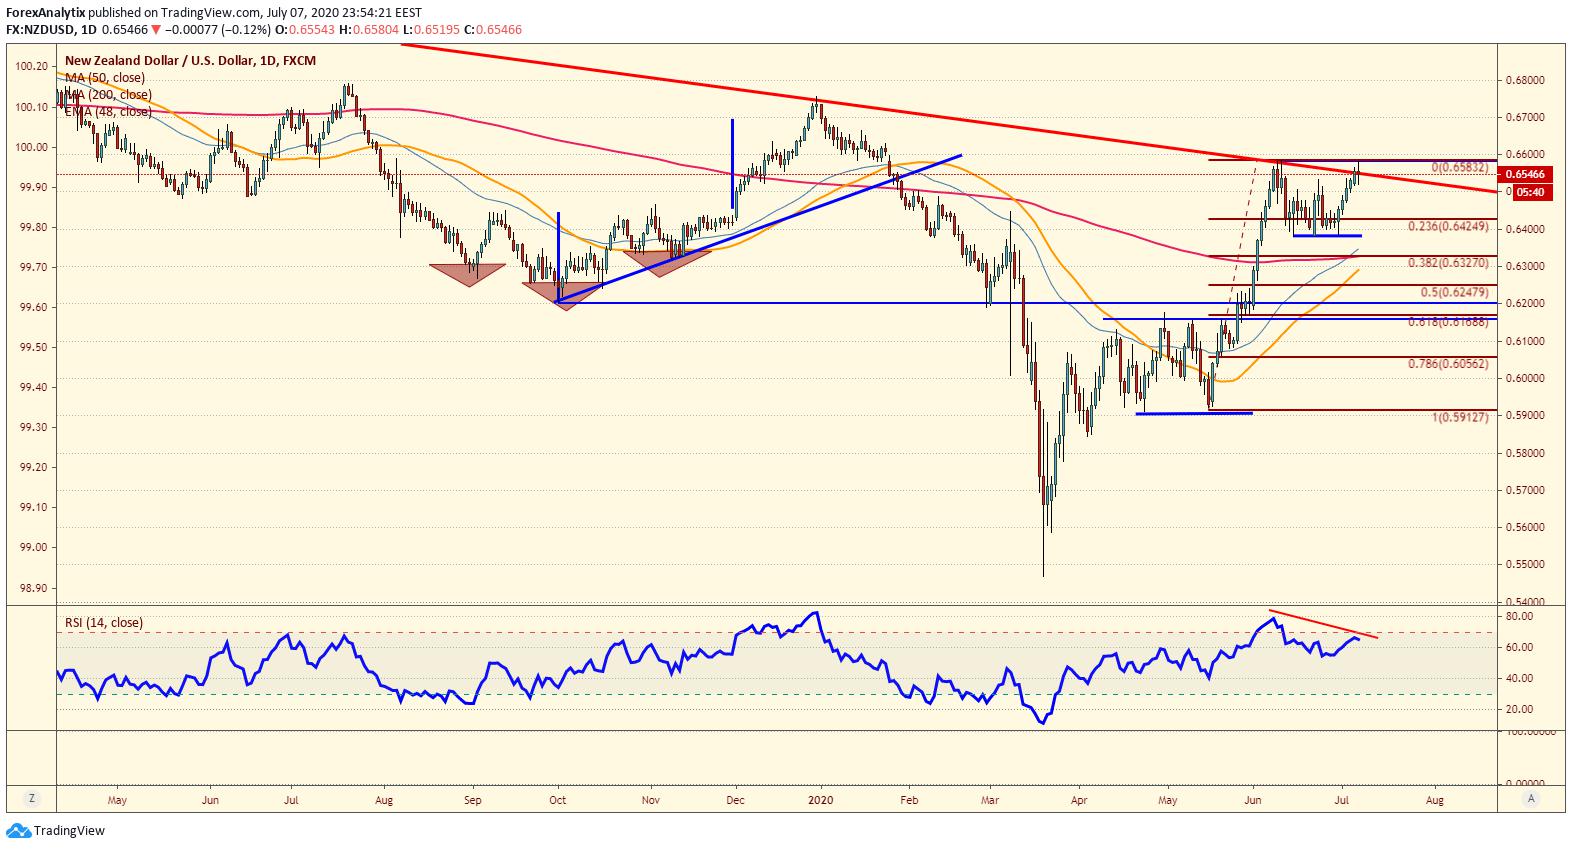
Chart of the day: NZD/USD

The recovery in the NZD/USD has been nothing short of spectacular the last few months, and now the pair is challenging a trend line which has been in existence since 2014. It was also tested in 2019 and twice this year. In addition, the horizontal resistance at the .6580 level has managed to cap the rally as well. A breakout above the .6600 level would be very bullish for the pair, but the RSI divergence is also a warning for the bulls that the trend line may not break, at least not yet.
Reprinted from FXStreet,the copyright all reserved by the original author.
Disclaimer: The content above represents only the views of the author or guest. It does not represent any views or positions of FOLLOWME and does not mean that FOLLOWME agrees with its statement or description, nor does it constitute any investment advice. For all actions taken by visitors based on information provided by the FOLLOWME community, the community does not assume any form of liability unless otherwise expressly promised in writing.
FOLLOWME Trading Community Website: https://www.followme.com


Hot
No comment on record. Start new comment.