Silver Price Analysis: XAG/USD hangs near one-week low, just above mid-$24.00s

- Silver drifts lower for the second straight day and touches a one-and-half-week low.
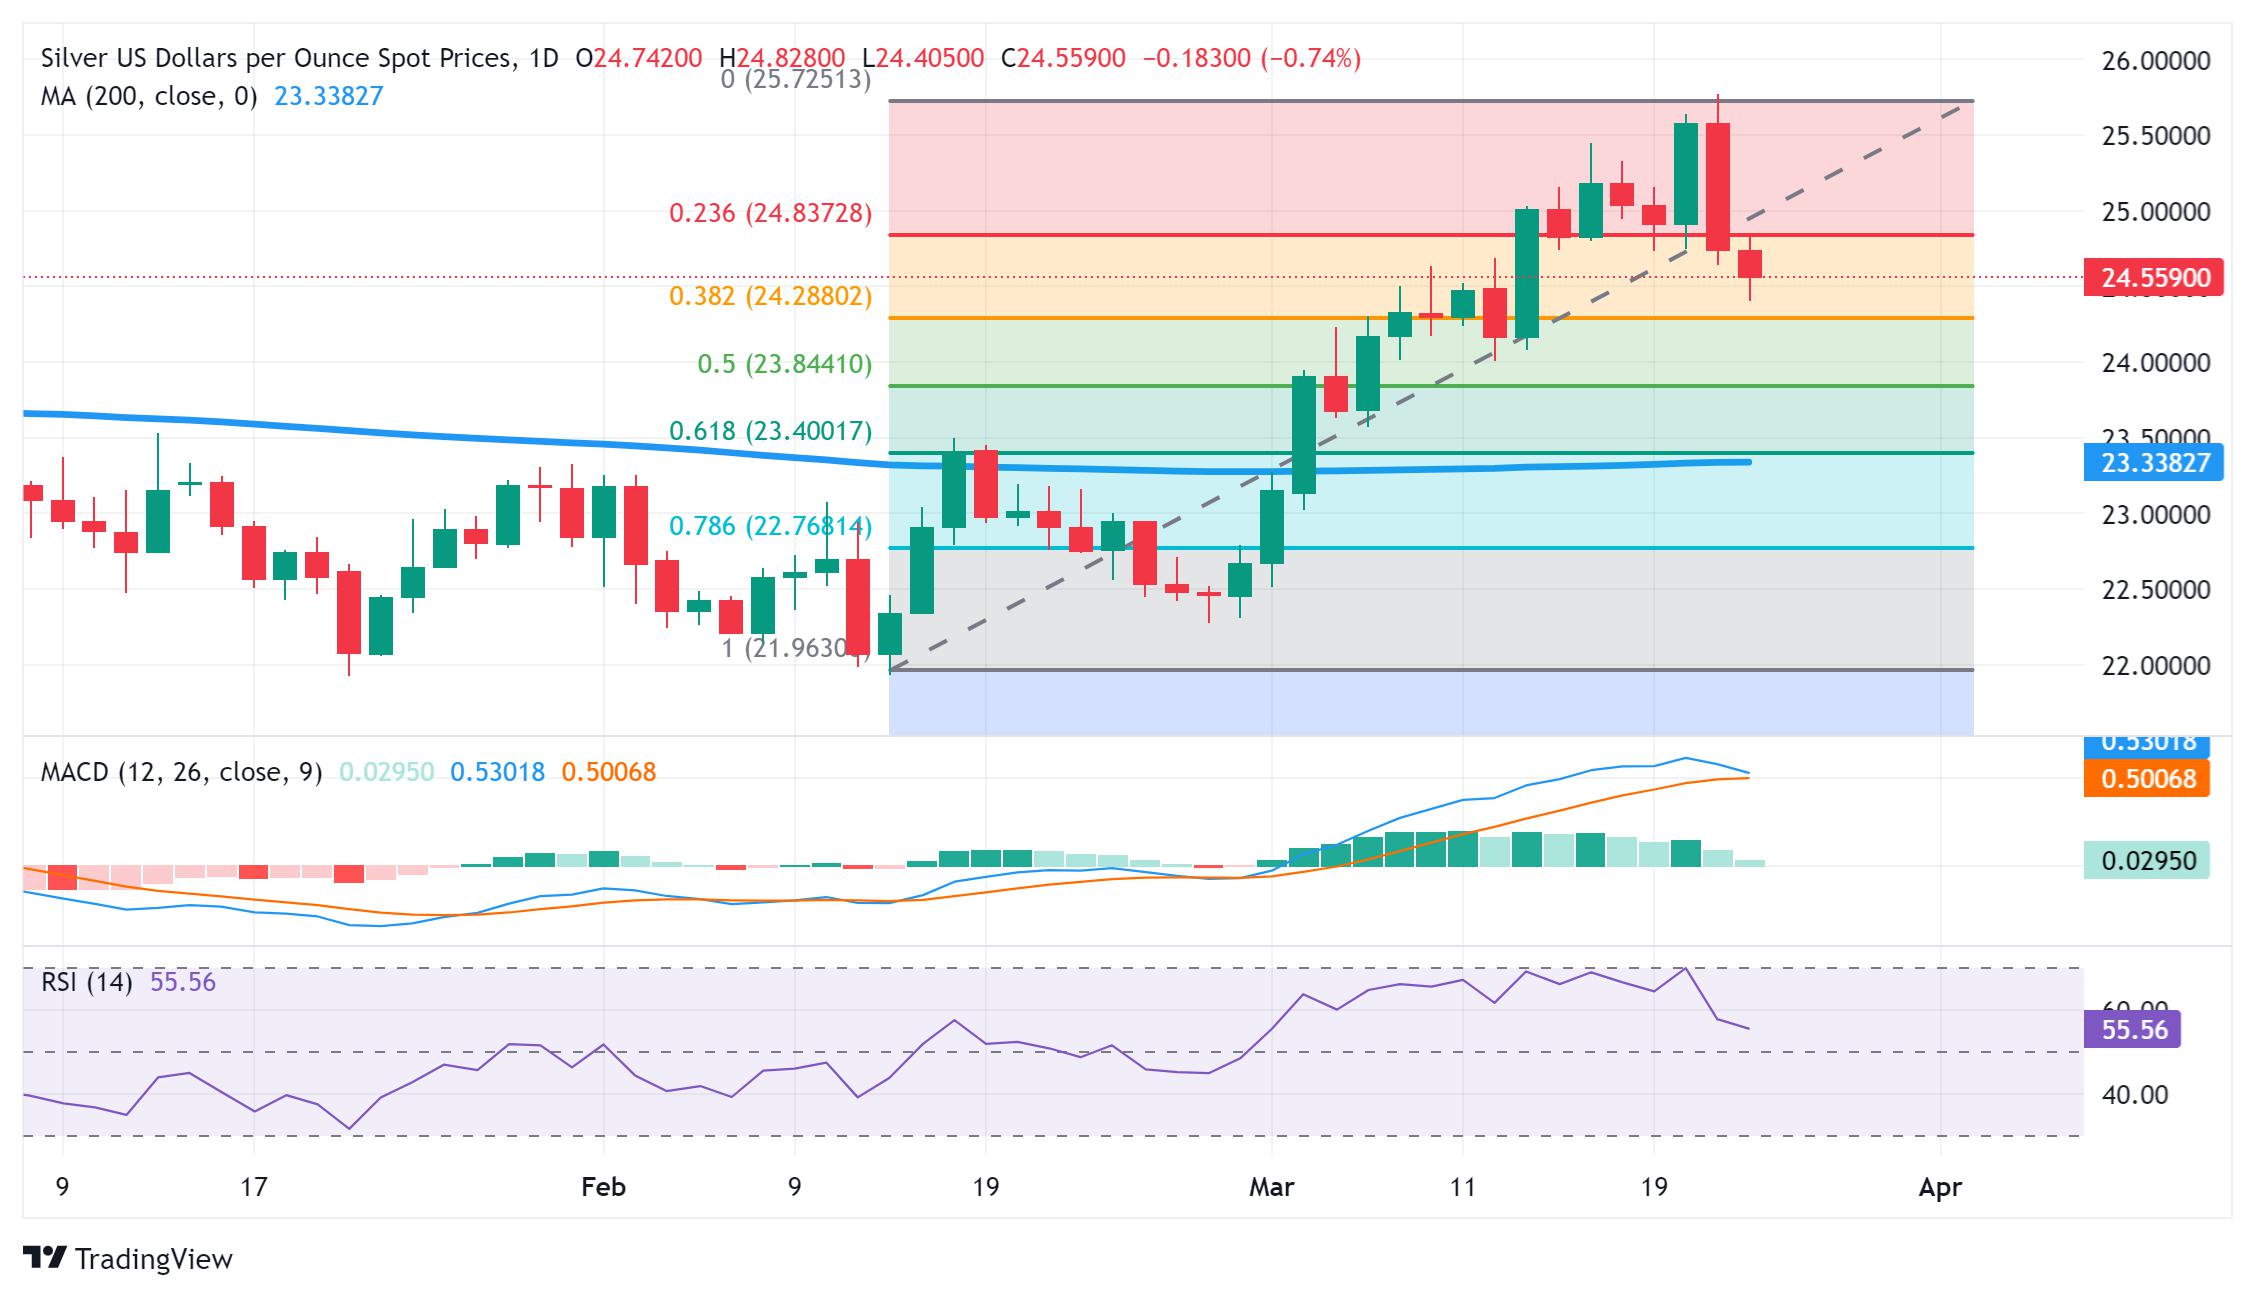
- The mixed technical setup warrants caution before placing aggressive bearish bets.
- A convincing break below the 38.2% Fibo. level will set the stage for deeper losses.
Silver (XAG/USD) extends the previous day's sharp retracement slide from the $25.75-$25.80 region, or its highest level since early December and remains under some selling pressure for the second straight day on Friday. The white metal maintains its offered tone through the early part of the European session and is currently placed around mid-$24.00s, just above a one-and-half-week low touched earlier today.
From a technical perspective, the overnight breakdown through the $24.85-$24.80 horizontal support, coinciding with the 23.6% Fibonacci retracement level of the February-March rally was seen as a fresh trigger for bearish traders. The subsequent slide, however, stalls ahead of the 38.2% Fibo. level, which should now act as a key pivotal point. Meanwhile, oscillators on the daily chart – though have been losing traction – are still holding in the positive territory.
Hence, it will be prudent to wait for a sustained break below the said support near the $24.30 region before positioning for any further depreciating move for the XAG/USD. The corrective decline could then drag the white metal below the $24.00 round-figure mark, towards testing the 50% Fibo. level support near the $23.85 zone en route to the $23.40 confluence, comprising the 61.8% Fibo. and the very important 200-day Simple Moving Average (SMA).
On the flip side, the $24.80 horizontal support breakpoint could act as an immediate hurdle ahead of the $25.00 psychological mark. A sustained strength beyond the latter might trigger a bout of a short-covering rally towards the $25.50 region en route to the YTD peak, around the $25.75-$25.80 region. This is followed by the December 2023 swing high, just ahead of the $26.00 round figure, which if cleared decisively will set the stage for additional gains.
Silver daily chart
Reprinted from FXStreet,the copyright all reserved by the original author.
Disclaimer: The content above represents only the views of the author or guest. It does not represent any views or positions of FOLLOWME and does not mean that FOLLOWME agrees with its statement or description, nor does it constitute any investment advice. For all actions taken by visitors based on information provided by the FOLLOWME community, the community does not assume any form of liability unless otherwise expressly promised in writing.
FOLLOWME Trading Community Website: https://www.followme.com


Hot
No comment on record. Start new comment.