NZD/USD Price Analysis: A break above 0.6000 could approach 14-day EMA, 23.6% Fibonacci

- NZD/USD tests the psychological level of 0.6000 on Monday.
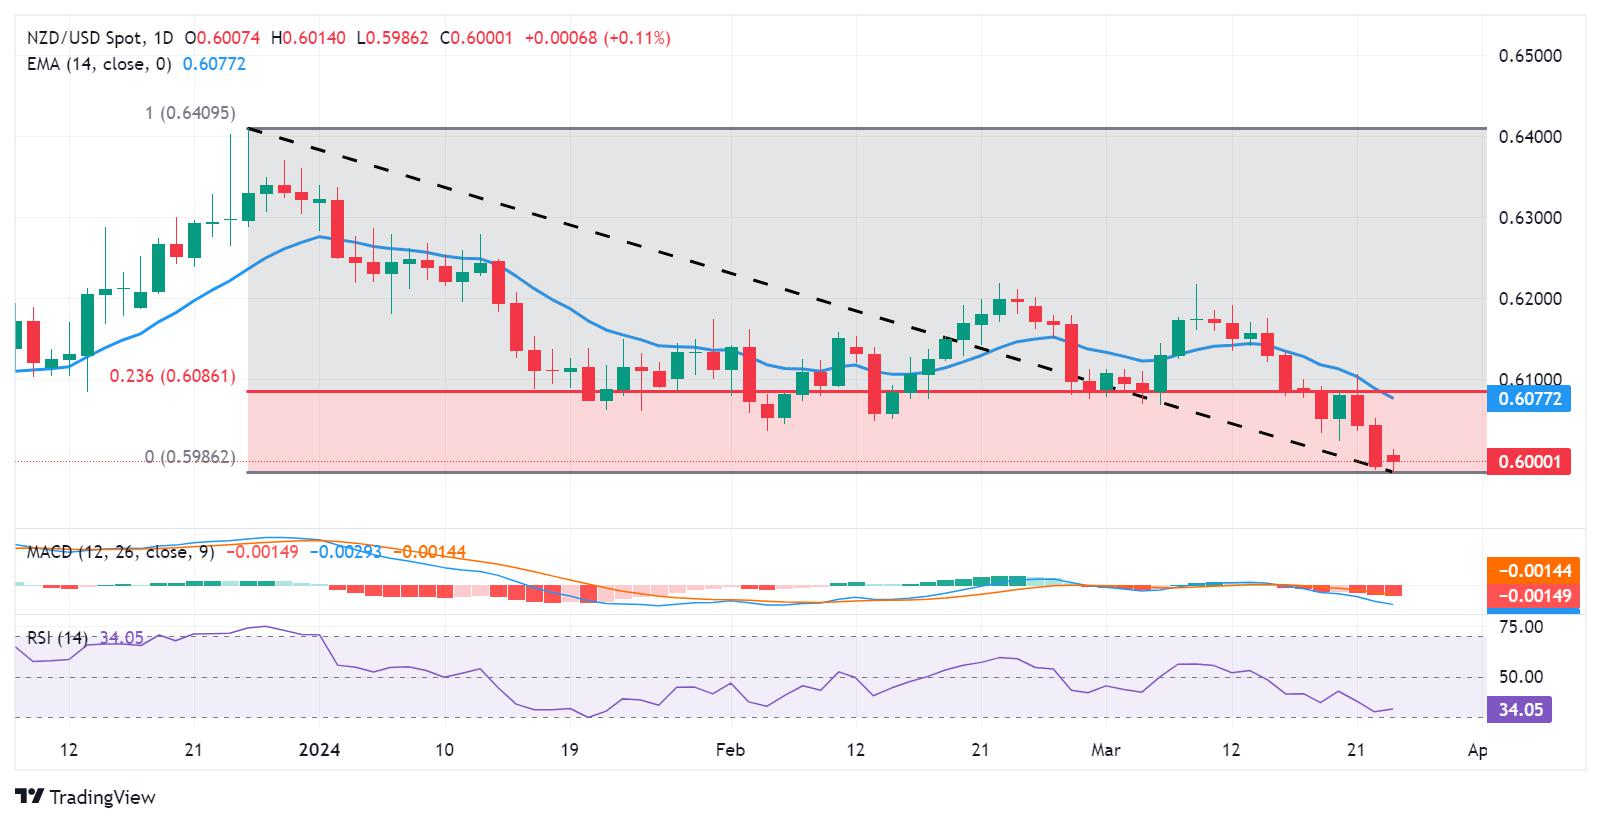
- The break above 0.6050 could lead the pair to navigate the area around the 14-day EMA and the 23.6% Fibonacci level.
- The major level of 0.5950 could act as support, following the psychological support at 0.5900 level.
NZD/USD continues its losing streak for the third successive session as the US Dollar (USD) falls on the dovish sentiment surrounding the Federal Reserve's stance on the trajectory of interest rates, with market sentiment leaning towards the Fed initiating interest rate cuts starting in June. The pair has trimmed its intraday gains and hovers around the psychological level of 0.6000 during the European session on Monday.
The NZD/USD pair could find a key barrier lies at the major level of 0.6050. A break above this level could lead the pair to navigate the area around the 14-day Exponential Moving Average (EMA) of 0.6076 and the 23.6% Fibonacci retracement level of 0.6086. A further movement could test the psychological level of 0.6100.
According to the Moving Average Convergence Divergence (MACD) analysis, a prevailing downward sentiment is indicated for the NZD/USD pair. This is evidenced by the MACD line positioned below the centerline and shows the divergence below the signal line, signaling a bearish trend. Furthermore, the 14-day Relative Strength Index (RSI) is below the 50 level, providing additional confirmation of the bearish sentiment.
On the downside, the NZD/USD pair could find the key support at the major level of 0.5950. A break below the latter could put pressure on the pair to navigate further support at a psychological level of 0.5900.
NZD/USD: Daily Chart
Reprinted from FXStreet,the copyright all reserved by the original author.
Disclaimer: The content above represents only the views of the author or guest. It does not represent any views or positions of FOLLOWME and does not mean that FOLLOWME agrees with its statement or description, nor does it constitute any investment advice. For all actions taken by visitors based on information provided by the FOLLOWME community, the community does not assume any form of liability unless otherwise expressly promised in writing.
FOLLOWME Trading Community Website: https://www.followme.com


Hot
No comment on record. Start new comment.