AUD/JPY Price Analysis: Bears show momentary dominance, long-term bullish tilt remains

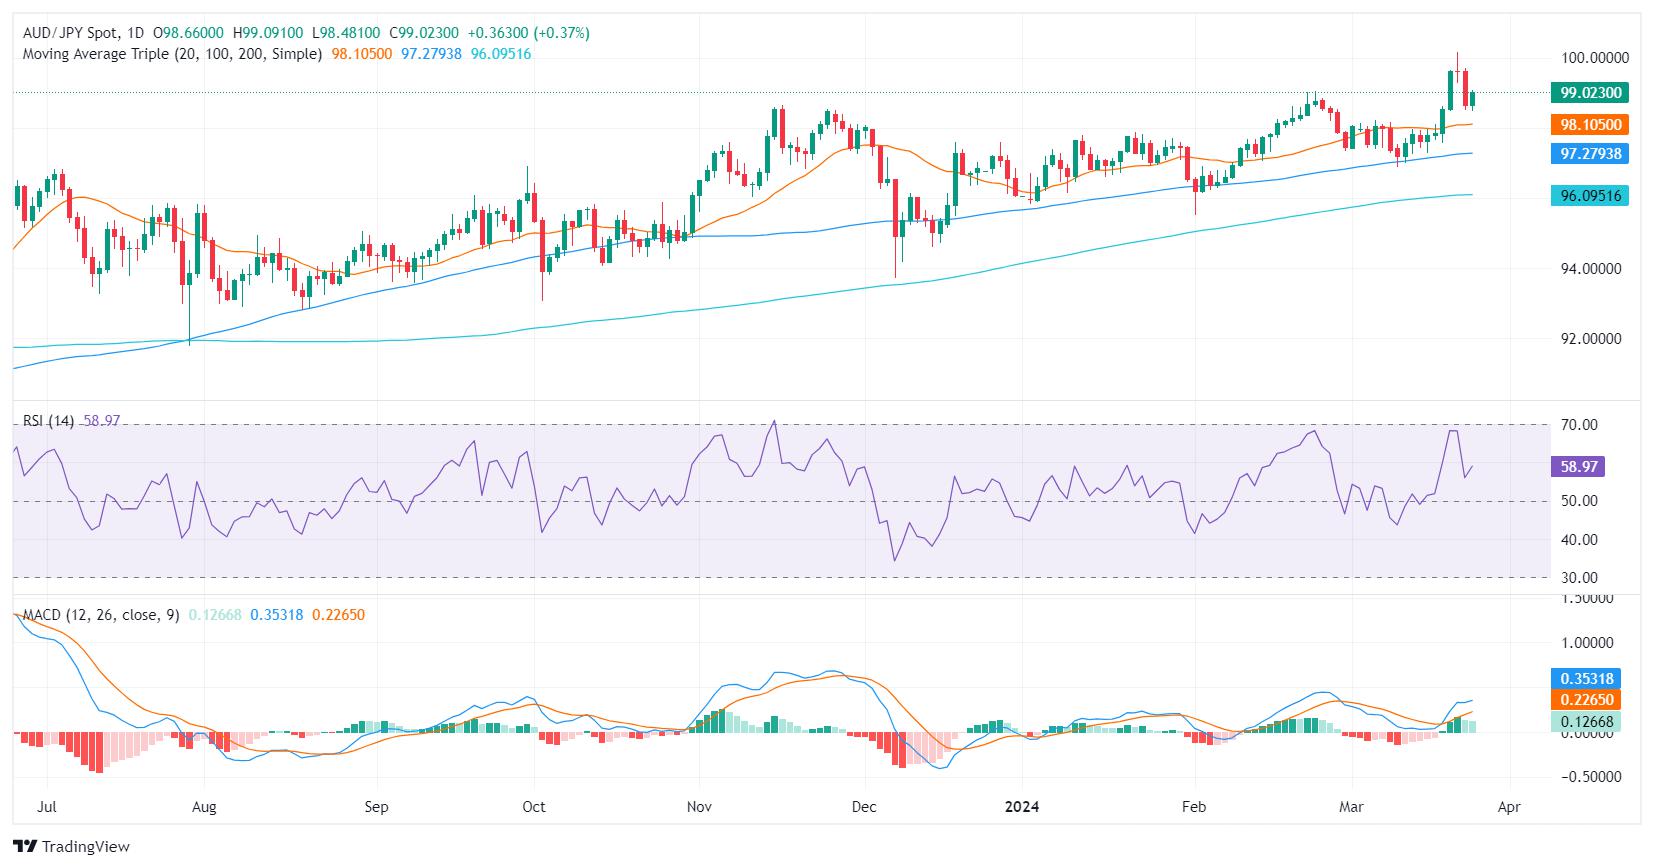
- The daily chart shows a mild bullish momentum as indicated by the RSI, whereas the MACD signals a balanced market environment.
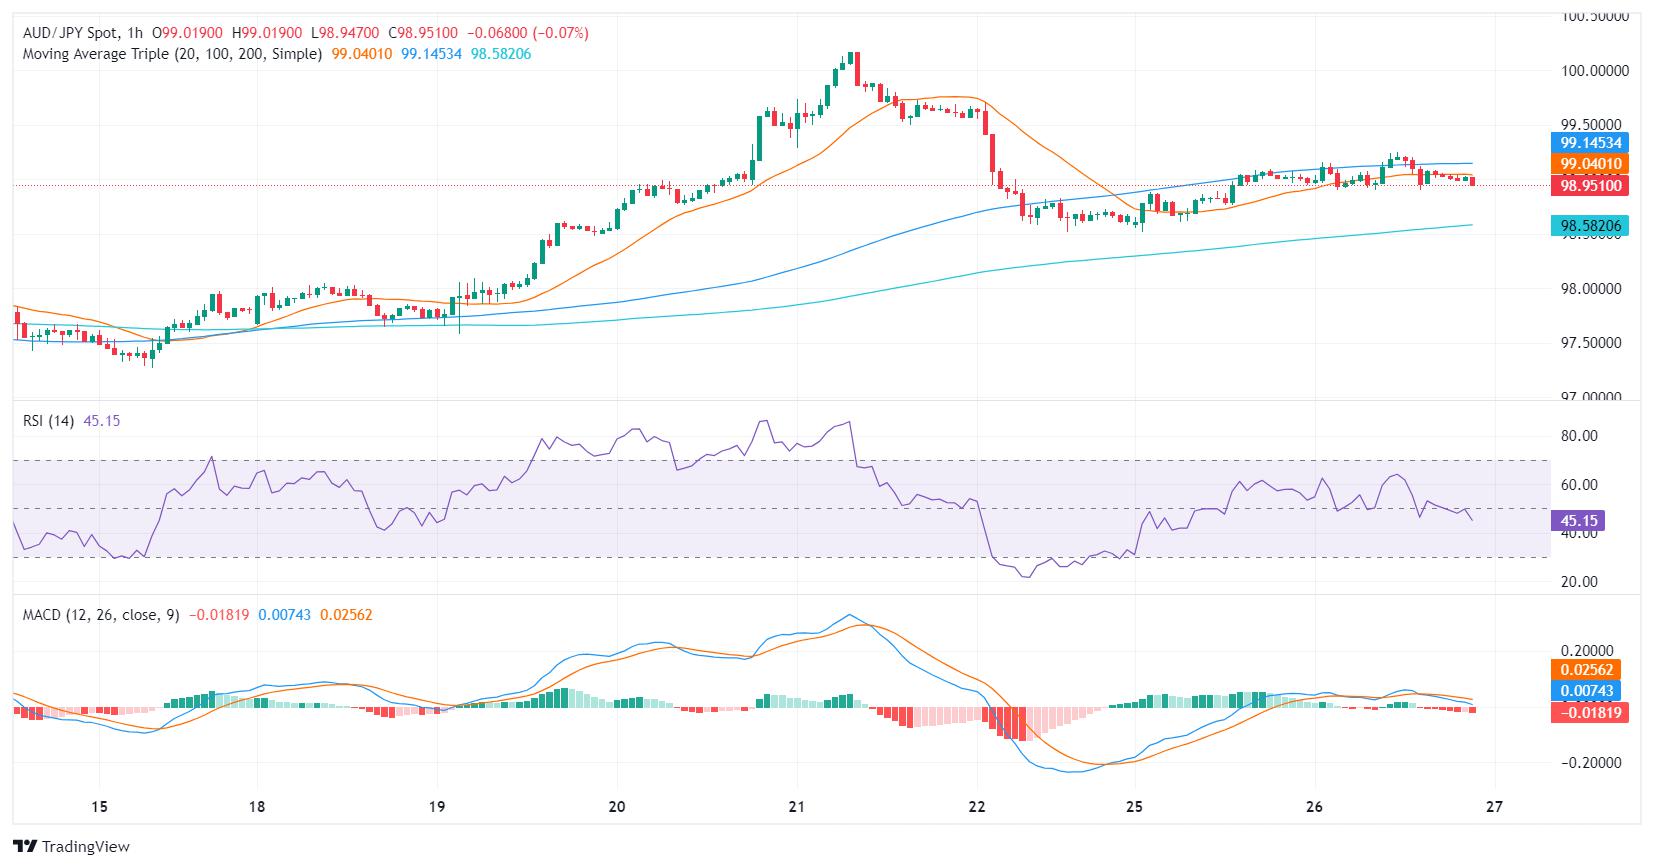
- On the hourly chart, growing selling pressure is evident.
In Tuesday's session, AUD/JPY was seen declining to 98.95, marking mild losses. Despite the insignificant setback, neither buyers nor sellers have gained a distinct advantage, indicating potential market stability or a possible shift in direction. While signs of selling pressure are evident, the pair exhibits a strong stand over the 20,100 and 200-day Simple Moving Averages (SMAs), signifying long-term bullish sentiment. That being said, there are signals that the sellers are present after pushing the pair down by nearly 1% last Friday.
On the daily chart, the Relative Strength Index (RSI) stands with a neutral slope. The flattening trend and the green bars of the Moving Average Convergence Divergence (MACD) hint that the market remains largely balanced, with neither buyers nor sellers having a distinct edge on Tuesday.
AUD/JPY daily chart
Moving onto the hourly chart, the RSI trajectory appears slightly bearish, with recent readings below 50, suggesting mounting selling pressure. The rising red MACD histogram bars further confirm the existing negative momentum.
AUD/JPY hourly chart
When assessing both charts, the short-term outlook seems to contrast with the daily chart's indications, which appear less bearish. It is evident that the bears are taking a breather following last week’s strong downward movements, but are still around the corner. However, the 1% dip seen on Friday, hasn’t affected yet the overall bullish trend.
Reprinted from FXStreet,the copyright all reserved by the original author.
Disclaimer: The content above represents only the views of the author or guest. It does not represent any views or positions of FOLLOWME and does not mean that FOLLOWME agrees with its statement or description, nor does it constitute any investment advice. For all actions taken by visitors based on information provided by the FOLLOWME community, the community does not assume any form of liability unless otherwise expressly promised in writing.
FOLLOWME Trading Community Website: https://www.followme.com


Hot
No comment on record. Start new comment.