GBP/USD Price Analysis: Could test the level of 1.2600, next support at March’s low

- GBP/USD could break the psychological support of the 1.2600 level to revisit March’s low at 1.2575.
- Technical analysis suggests the bearish sentiment to test the major support of the 1.2550 level.
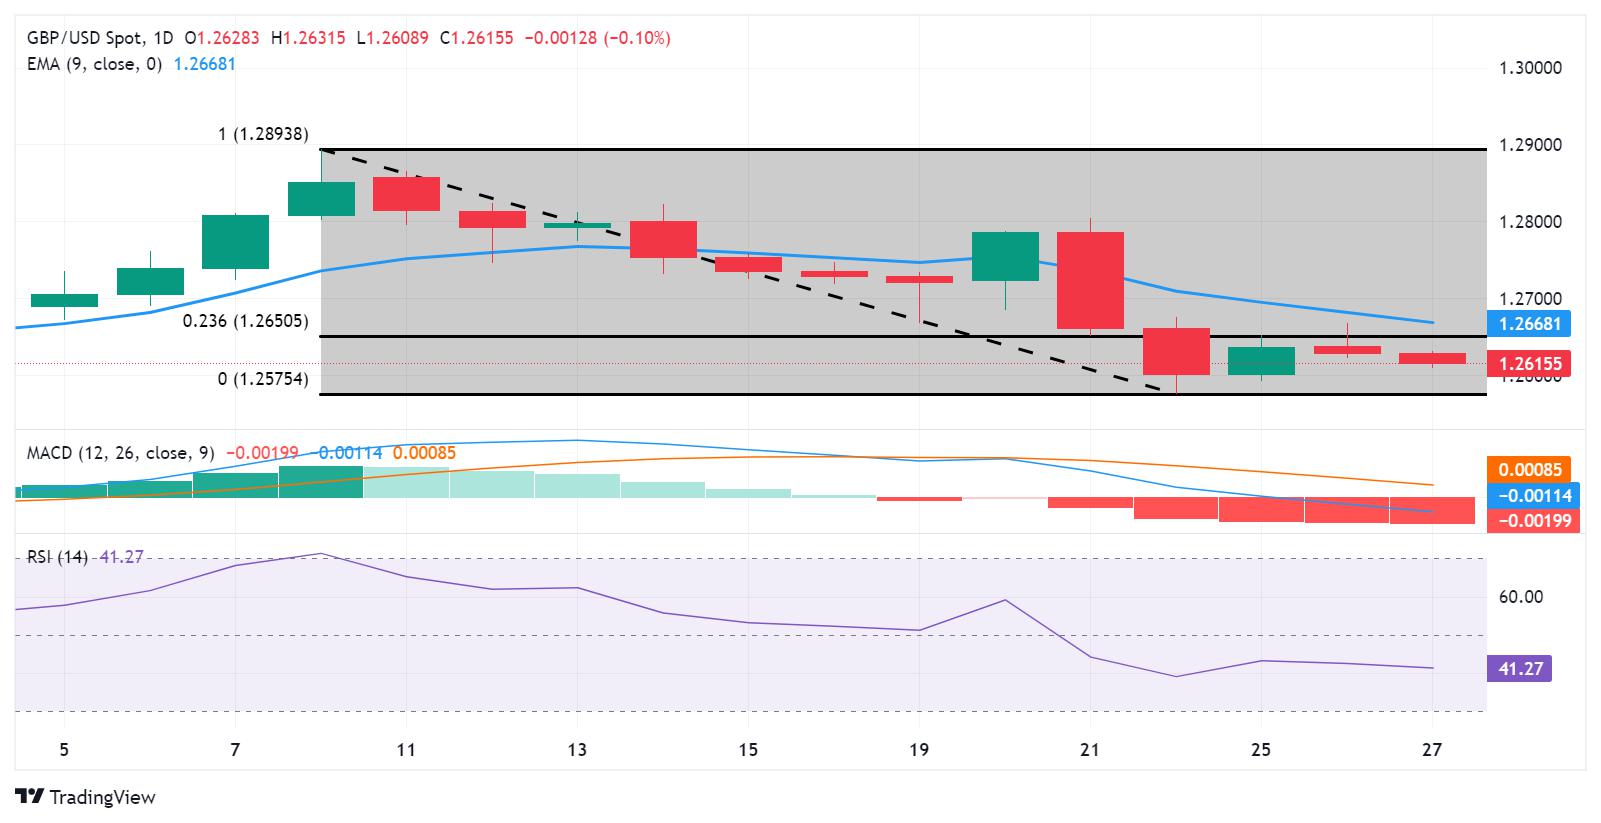
- The resistance zone could be found around the 23.6% Fibonacci retracement level of 1.2650 level and the nine-day EMA at 1.2668.
GBP/USD extends its losses for the second consecutive day, depreciating to near 1.2620 during the Asian session on Wednesday. The pair could test the psychological support level of 1.2600. If this level is breached, it could prompt the pair to revisit March’s low at 1.2575.
The technical analysis of the GBP/USD pair suggests a bearish trend. The 14-day Relative Strength Index (RSI) is positioned below 50, indicating a bearish sentiment. Additionally, the Moving Average Convergence Divergence (MACD) confirms the bearish trend, as the MACD line is below the centerline and exhibits divergence below the signal line.
The bearish sentiment could influence the GBP/USD pair to test the major support of 1.2550 level, followed by February’s low of 1.2518.
On the upside, the GBP/USD pair could meet the major barrier at 23.6% Fibonacci retracement level of 1.2650 level. A breakthrough above this barrier could exert upward support for the pair to test the nine-day Exponential Moving Average (EMA) at 1.2668.
If the GBP/USD pair surpasses the latter, it could approach the psychological level of 1.2700.
GBP/USD: Daily Chart
Reprinted from FXStreet,the copyright all reserved by the original author.
Disclaimer: The content above represents only the views of the author or guest. It does not represent any views or positions of FOLLOWME and does not mean that FOLLOWME agrees with its statement or description, nor does it constitute any investment advice. For all actions taken by visitors based on information provided by the FOLLOWME community, the community does not assume any form of liability unless otherwise expressly promised in writing.
FOLLOWME Trading Community Website: https://www.followme.com


Hot
No comment on record. Start new comment.