NZD/USD Price Analysis: Finds temporary support slightly below 0.6000, downside remains favored

- NZD/USD is expected to see more downside due to multiple headwinds.
- Investors remain uncertain ahead of the US core PCE inflation for February.
- A breakdown of the Double Top formation weakens the Kiwi asset.
The NZD/USD pair finds interim support near 0.5990 in the European session on Wednesday. The Kiwi asset is vulnerable in the broader term as the New Zealand economy has shifted into a technical recession. The economy was contracted in the last two quarters of 2023.
The Reserve Bank of New Zealand (RBNZ) is facing a balancing act between high inflation and a poor economic outlook. To maintain downward pressure on stubborn inflation, the RBNZ maintains the Official Cash Rate (OCR) at 5.5%. However, economic activities bear the consequences. Low liquidity flow in an economy dampens firms’ investment plans and consumer spending.
Meanwhile, asset-specific action is being observed in global markets as risk-perceived currencies face the heat of uncertainty ahead of the United States core Personal Consumption Expenditure price index (PCE) data for February, which will be published on Good Friday. S&P 500 futures have posted significant gains in the London session.
The US Dollar Index (DXY) rises to 104.40, an inch away from monthly high of 104.50. 10-year US Treasury yields remain unchanged at 4.23%.
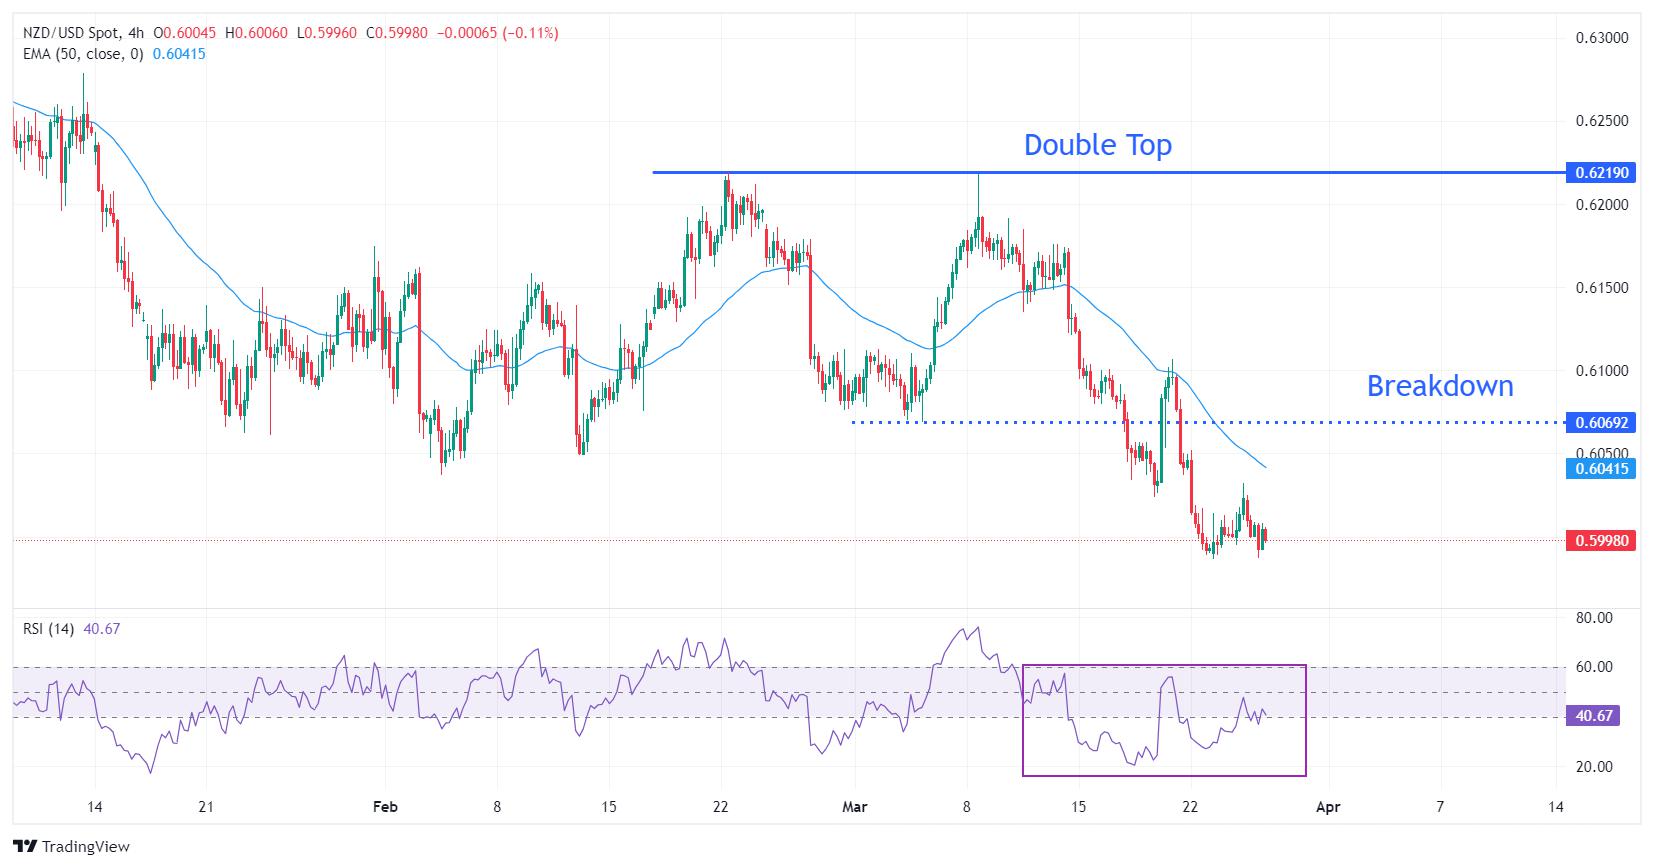
NZD/USD sees a sharp downside move after a breakdown of the Double Top chart formation near 0.6069 on a four-hour timeframe. The asset has tested territory below the psychological support of 0.6000 and is expected to discover more downside. The 50-period Exponential Moving Average (EMA) near 0.6040 is a major barricade for the New Zealand Dollar bulls.
The 14-period Relative Strength Index (RSI) oscillates in the bearish range of 20.00-60.000. Investors would look for building fresh shorts whenever the RSI witnessed a pullback to 60.00.
If the asset breaks below the intraday low of 0.5987, more downside will appear. This would drag the asset toward the November 17 low at 0.5940, followed by the round-level support of 0.5900.
In an alternate scenario, a recovery move above March 6 low at 0.6069 will drive the pair toward March 18 high at 0.6100. A breach of the latter will drive the asset further to March 12 low at 0.6135.
NZD/USD four-hour chart
Reprinted from FXStreet,the copyright all reserved by the original author.
Disclaimer: The content above represents only the views of the author or guest. It does not represent any views or positions of FOLLOWME and does not mean that FOLLOWME agrees with its statement or description, nor does it constitute any investment advice. For all actions taken by visitors based on information provided by the FOLLOWME community, the community does not assume any form of liability unless otherwise expressly promised in writing.
FOLLOWME Trading Community Website: https://www.followme.com


Hot
No comment on record. Start new comment.