GBP/USD Price Analysis: The first downside target is seen at the 1.2600–1.2605 zone

- GBP/USD drifts lower to 1.2620 in Friday’s early European trading hours.
- The bearish outlook of the pair remains intact above the key EMA; RSI indicator supports the downward momentum.
- The first upside barrier is seen in the 1.2645–1.2650 region; the 1.2600–1.2605 zone acts as an initial support level.
The GBP/USD pair trades on a weaker note around 1.2620 during the early European session on Friday. The decline of Pound Sterling (GBP) is backed by the growing speculation that the Bank of England (BoE) will begin the rate-cut cycle this year. Markets are fully pricing in the first rate cut in August, with a total of nearly three quarter-point interest rate cuts this year.
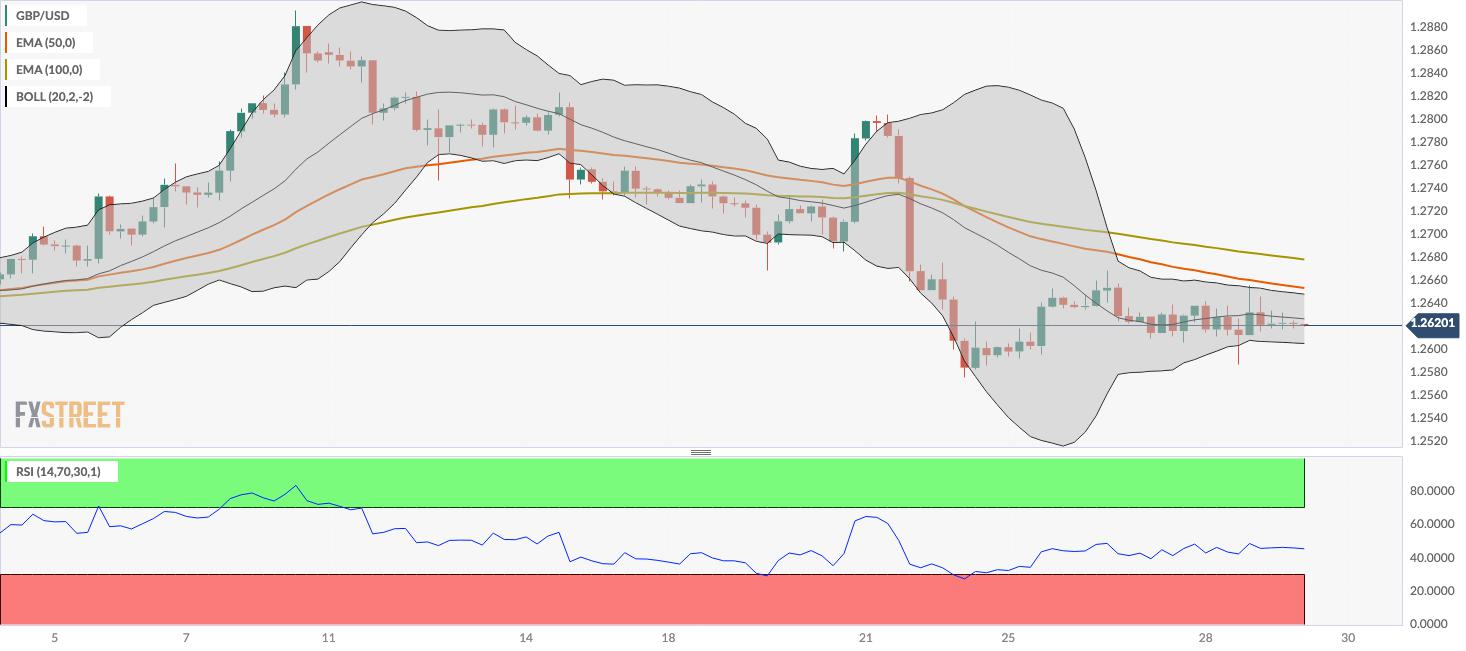
Technically, GBP/USD keeps the bearish vibe unchanged as the major pair is below the key 50- and 100-period Exponential Moving Average (EMA) on the four-hour chart. Furthermore, the Relative Strength Index (RSI) lies below the 50 midlines, suggesting the downward momentum of the pair and the further decline look favorable.
The immediate resistance level for GBP/USD is seen in the 1.2645–1.2650 region, representing the confluence of the upper boundary of the Bollinger Band and the 50-period EMA. Any follow-through buying above the latter will expose the 100-period EMA at 1.2677. The additional upside filter to watch is a high of March 18 at 1.2746, en route to the 1.2800 psychological round mark.
On the downside, the lower limit of the Bollinger Band at the 1.2600–1.2605 zone acts as an initial support level for the major pair. A decisive break below this level will pave the way to a low of March 22 at 1.2575. The next downside target is located at a low of February 14 at 1.2535, and finally at the 1.2500 round figure.
GBP/USD four-hour chart
Reprinted from FXStreet,the copyright all reserved by the original author.
Disclaimer: The content above represents only the views of the author or guest. It does not represent any views or positions of FOLLOWME and does not mean that FOLLOWME agrees with its statement or description, nor does it constitute any investment advice. For all actions taken by visitors based on information provided by the FOLLOWME community, the community does not assume any form of liability unless otherwise expressly promised in writing.
FOLLOWME Trading Community Website: https://www.followme.com


Hot
No comment on record. Start new comment.