NZD/JPY Price Analysis: Bulls retain control and present battle around the 20-day SMA

- The daily chart reveals a positive momentum, with the RSI and MACD demonstrating the upper hand of buyers.
- The hourly RSI is exchanging hands around the 50 level.
- The pair is building strong support around the 20-day SMA.
The NZD/JPY currency pair is trading near the 91.541 level, experiencing what appears to be a robust uptrend. Indicators on the daily chart remain strong while hourly indicators stand somewhat mixed. On the negative side, for bears to start talking, they must breach the 20-day Simple Moving Average (SMA) at 91.00 which is acting as a strong support in favor of the bulls.
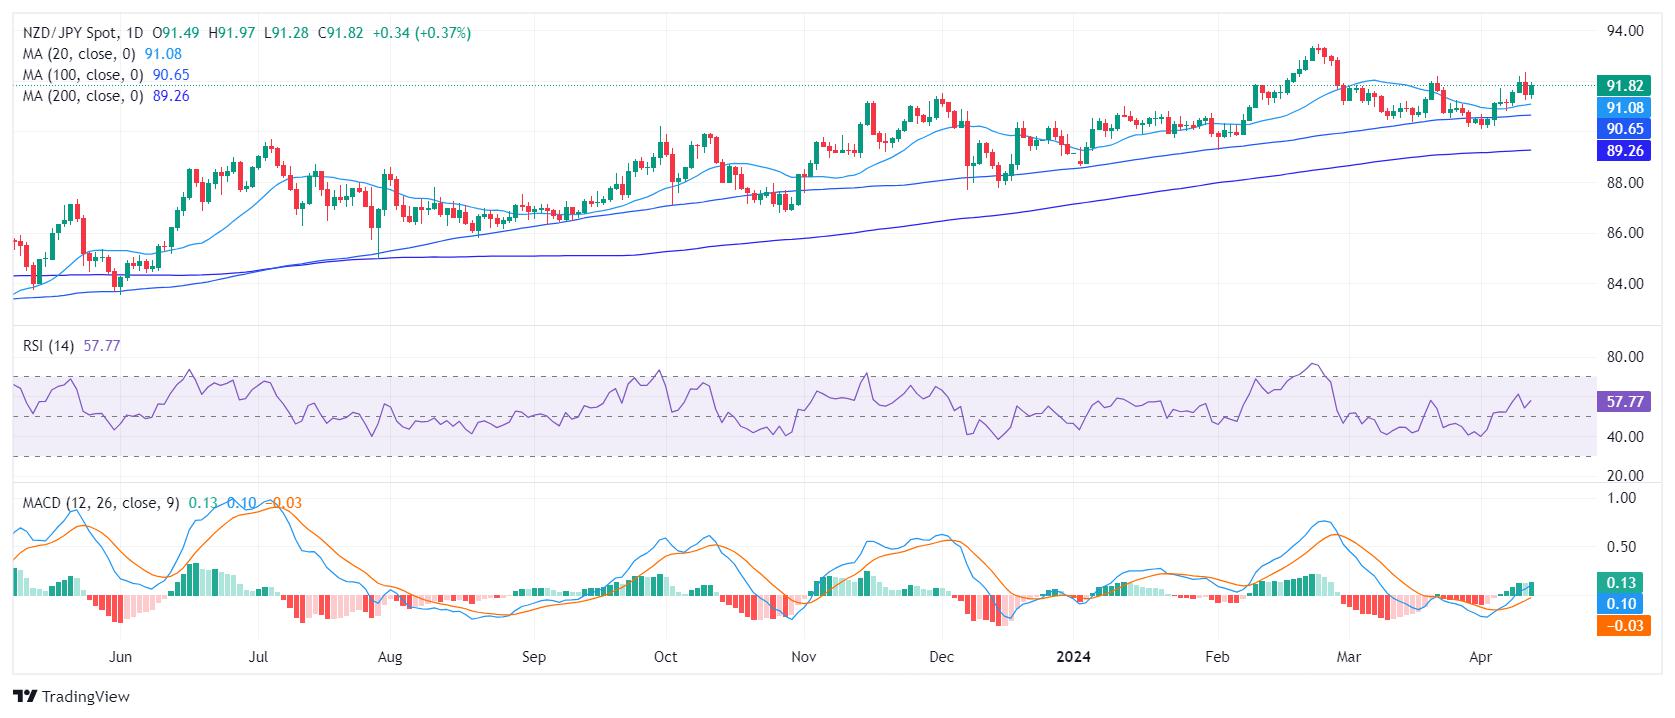
On the daily chart, the Relative Strength Index (RSI) shows positive momentum for the NZD/JPY pair, settling at about 56. The recent history of the RSI in positive territory highlights the dominance of buyers, occasionally counterbalanced with dips flirting with the negative domain. Concurrently, the MACD histogram displays green bars, further indicating positive momentum in the market.
NZD/JPY daily chart
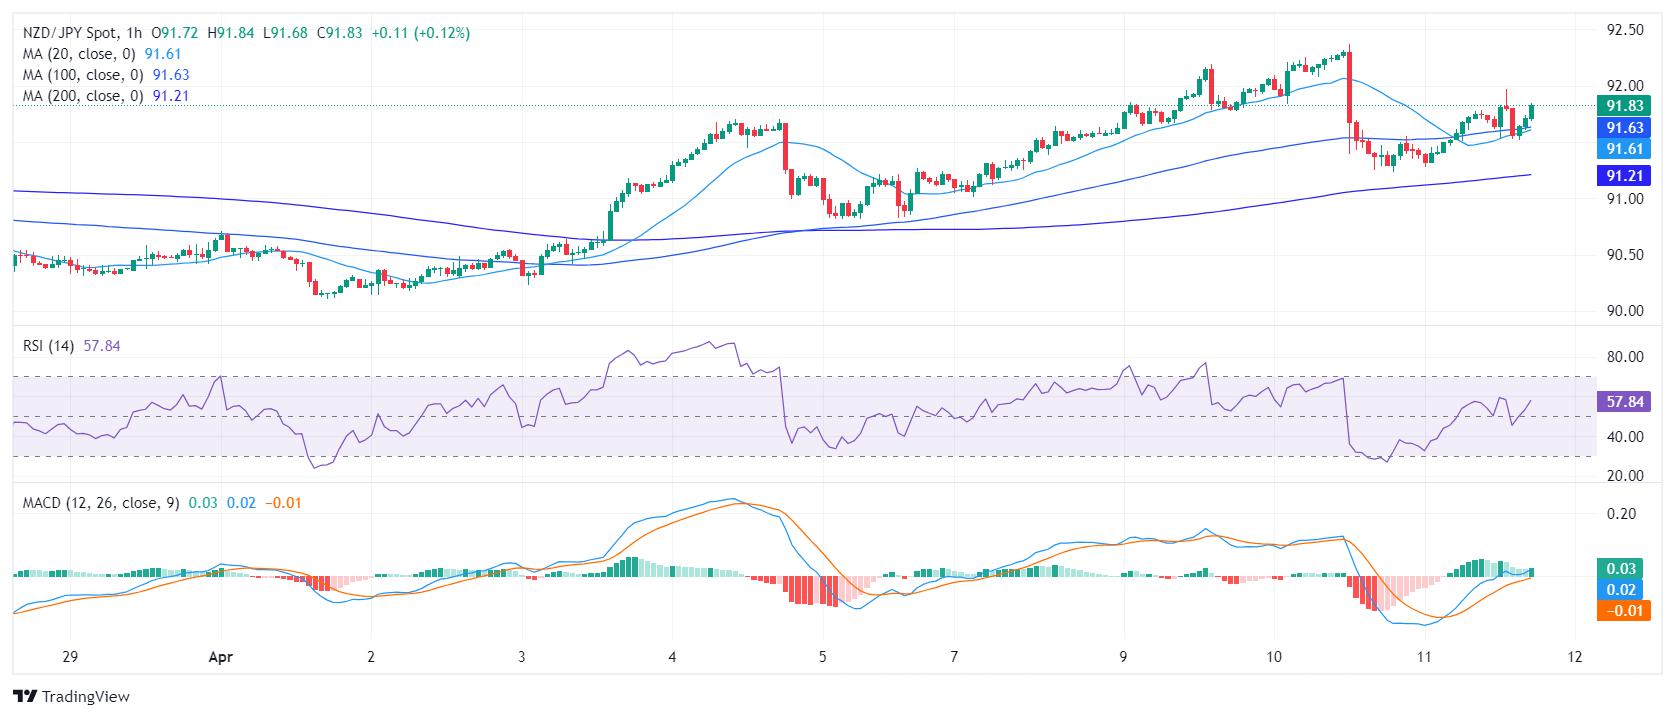
Moving to the hourly chart, the RSI fluctuates around the neutral mark of 50, with the latest reading jumping back to 57 after a slight decline earlier in the session. The MACD histogram continues to print flat green bars, indicating a flattening buying momentum.
NZD/JPY hourly chart
Taking into account this technical landscape, the NZD/JPY shows a bullish inclination in a broader outlook. It stands notably above the 20, 100, and 200-day Simple Moving Averages (SMAs), indicating a consistent uptrend. As long as the pair holds above the key 20-day average, the bullish trend will remain intact. However, the mixed outlook on the hourly chart advises that the buyers may give up ahead of the Asian session which could pave the way for a retest of the mentioned average.
Reprinted from FXStreet,the copyright all reserved by the original author.
Disclaimer: The content above represents only the views of the author or guest. It does not represent any views or positions of FOLLOWME and does not mean that FOLLOWME agrees with its statement or description, nor does it constitute any investment advice. For all actions taken by visitors based on information provided by the FOLLOWME community, the community does not assume any form of liability unless otherwise expressly promised in writing.
FOLLOWME Trading Community Website: https://www.followme.com


Hot
No comment on record. Start new comment.