EUR/JPY Price Analysis: Bullish trend perseveres, bears confronts crucial SMA

- Continued placement of EUR/JPY above key SMA levels shows strong bullish sentiment.
- The daily chart indicators reveal a loss of the bullish momentum.
- The hourly RSI and rising MACD depict short-term buyers' shift to regain momentum.
- The pair's approach towards the key SMA level at 163.09 raises the possibility of a trend shift.
The EUR/JPY pair currently trades at approximately 164.37, indicating a slight decrease. Despite the bullish trend, traders must closely monitor for potential reversals as the bullish momentum wanes on the daily chart and bears approach the 20-day Simple Moving Average (SMA).
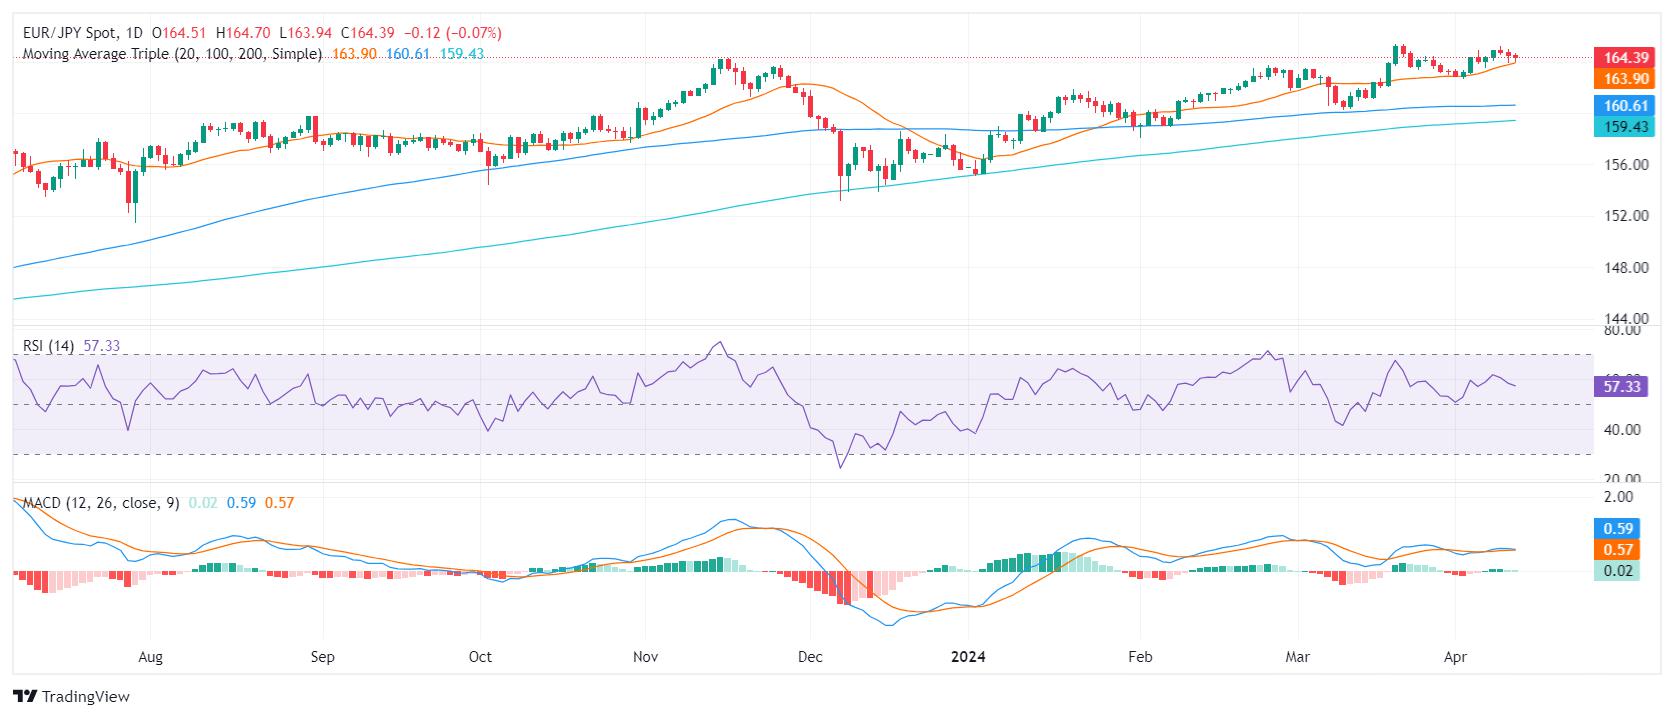
On the daily chart, The Relative Strength Index (RSI) consistently has been within the positive territory, but on Thursday it pointed south suggesting a loss of buying traction. The Moving Average Convergence Divergence (MACD) prints diminish green bars, also adding arguments to the momentum loss.
EUR/JPY daily chart
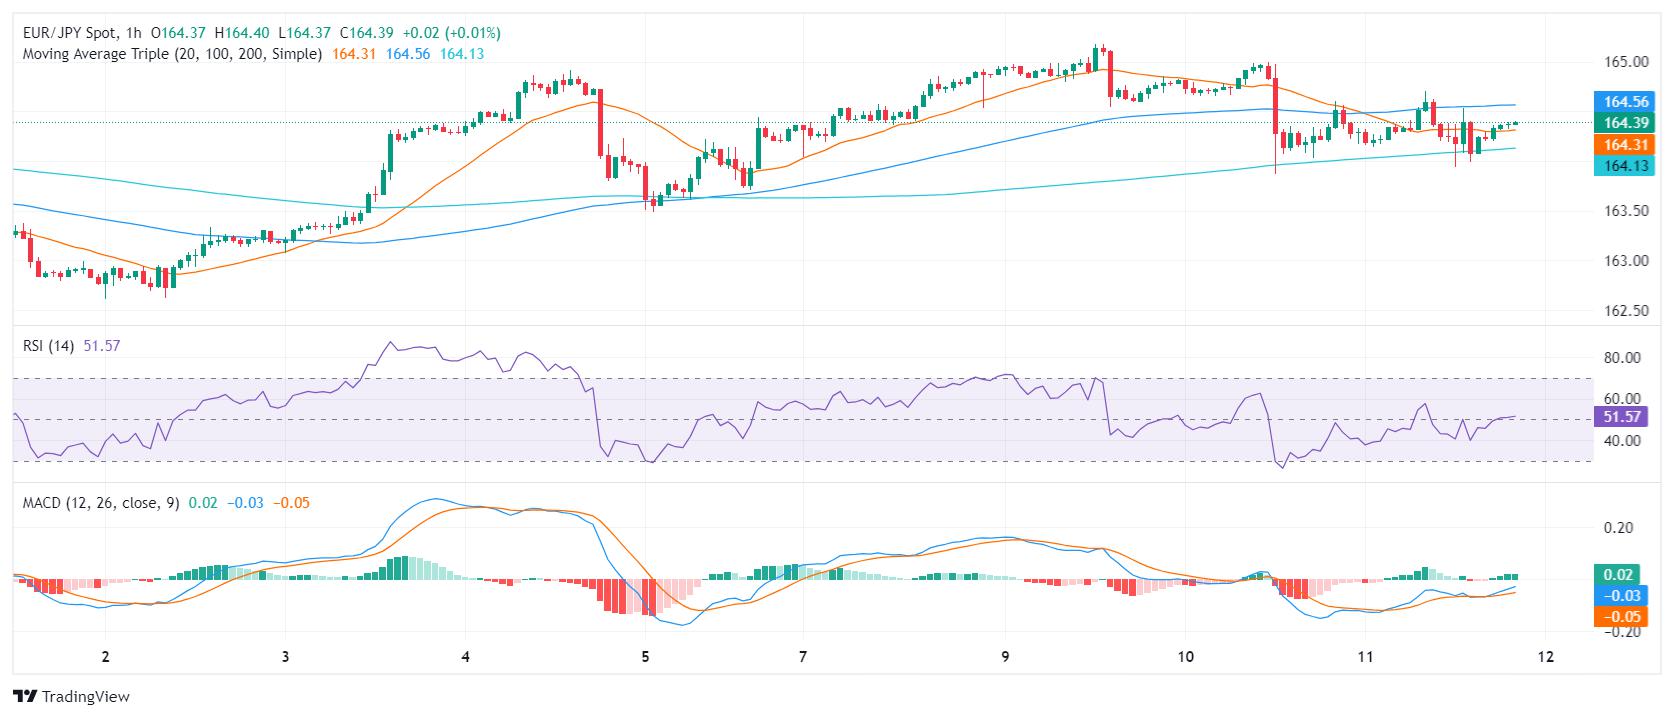
In contrast to the daily chart, the hourly chart tells a slightly different story. Here, the RSI readings fluctuate somewhat, particularly in the latest hours, with a decline towards the negative territory. However, recovery seems likely, as the latest hour reports an RSI value of 51, placing the index back in positive momentum. During these hours, the Moving Average Convergence Divergence (MACD) histogram prints rising green bars, indicating positive momentum.
EUR/JPY hourly chart
For a broader outlook, the EUR/JPY displays significant strength, remaining steadfast above its three crucial Simple Moving Averages (SMA) of 20, 100 and 200-day SMAs. Such positioning generally indicates a sustainable bullish climate, with strong implications for the short and long-term trend. However, today's signals suggest a potential challenge, as the pair edges closer to the 20-day SMA, currently set at 163.09 and any future movement below it could signal a shift to a bearish bias.
Reprinted from FXStreet,the copyright all reserved by the original author.
Disclaimer: The content above represents only the views of the author or guest. It does not represent any views or positions of FOLLOWME and does not mean that FOLLOWME agrees with its statement or description, nor does it constitute any investment advice. For all actions taken by visitors based on information provided by the FOLLOWME community, the community does not assume any form of liability unless otherwise expressly promised in writing.
FOLLOWME Trading Community Website: https://www.followme.com


Hot
No comment on record. Start new comment.