NZD/JPY Price Analysis: Bearish momentum overpowers, buyers struggle to retake the 20-day SMA

- The daily RSI and MACD reveal a weaker NZD/JPY, pointing towards bearish momentum.
- The negative trend is stronger on the hourly chart.
- Despite short-term bearish inclination, the cross position above main SMAs signifies a bullish sentiment in the longer term.
The NZD/JPY is trading at the 91.14 level, securing some daily gains after peaking at a daily high of 91.60. Despite a bearish short-term trend, the pair maintains a bullish position over the longer term, being positioned above key Simple Moving Averages (SMAs). For the short term, bears seem to be gearing up and bulls starting to weaken.
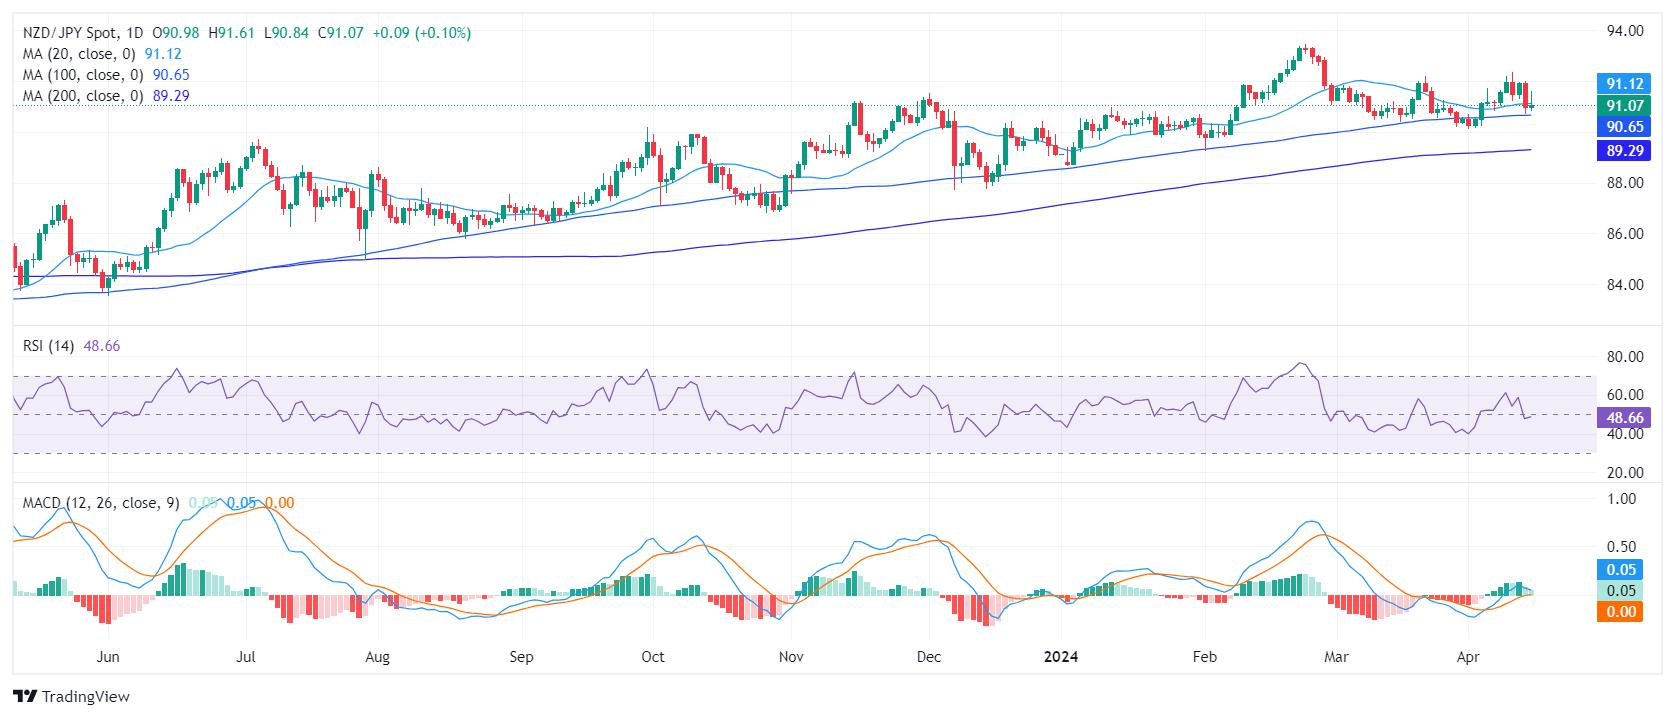
On the daily chart, the Relative Strength Index (RSI) is currently trending in negative territory, with the latest reading of 49. This, coupled with decreasing green bars on the Moving Average Convergence Divergence (MACD) histogram, indicates a slowdown in positive momentum, suggesting that sellers are currently dominating the market.
NZD/JPY daily chart
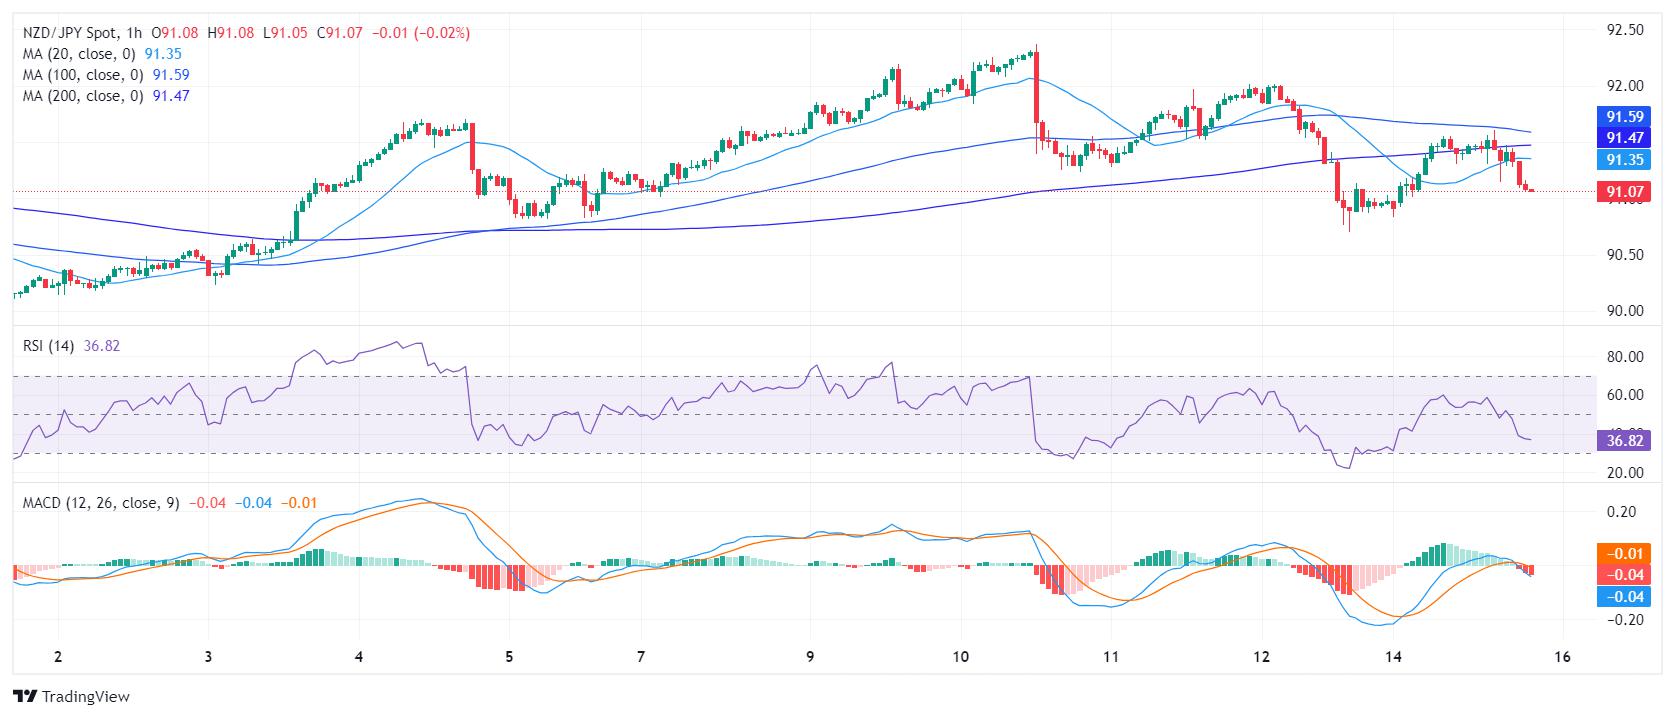
Switching to the hourly chart, the RSI similarly shows lower readings, with the latest value at 43, signaling a stronger negative trend in this time frame. Additionally, the MACD histogram shows an increase in red bars, reinforcing the negative momentum. This shift could indicate an increase in selling pressure during recent trading sessions and that the cross may see further downside ahead of the Asian session.
NZD/JPY hourly chart
The broader inspection of NZD/JPY illustrates a mixed technical scenario according to its position relative to its Simple Moving Averages (SMAs). In the short term, bearish tendencies are apparent as the NZD/JPY fell below the 20-day SMA last week and failed to re-conquer it. This move might trigger selling pressure from a short-term perspective. However, the position of NZD/JPY above the 100-day and 200-day SMAs shows a more bullish underlying structure in longer-term horizons.
In case the bulls fail to regain the 20-day SMA, the cross might be exposed to further downside in the coming sessions.
Reprinted from FXStreet,the copyright all reserved by the original author.
Disclaimer: The content above represents only the views of the author or guest. It does not represent any views or positions of FOLLOWME and does not mean that FOLLOWME agrees with its statement or description, nor does it constitute any investment advice. For all actions taken by visitors based on information provided by the FOLLOWME community, the community does not assume any form of liability unless otherwise expressly promised in writing.
FOLLOWME Trading Community Website: https://www.followme.com


Hot
No comment on record. Start new comment.