USD/JPY Price Analysis: Dominant uptrend continues

- USD/JPY extends its uptrend into the 154.00s.
- It may be forming a Measured Move pattern with an end target of 156.11.
- RSI is overbought, however, warning a correction may be on the horizon.
USD/JPY is trading in the upper 154.00s. It has formed what looks like a Measured Move price pattern composed of three waves, commonly labeled A, B and C.
In the case of Measured Moves, the end of wave C can be reliably predicted because it is often at the point where wave C is equal in length to wave A, or a Fibonacci ratio of wave A. At the very least wave C normally extends to a 0.618 ratio of A.
USD/JPY Daily Chart
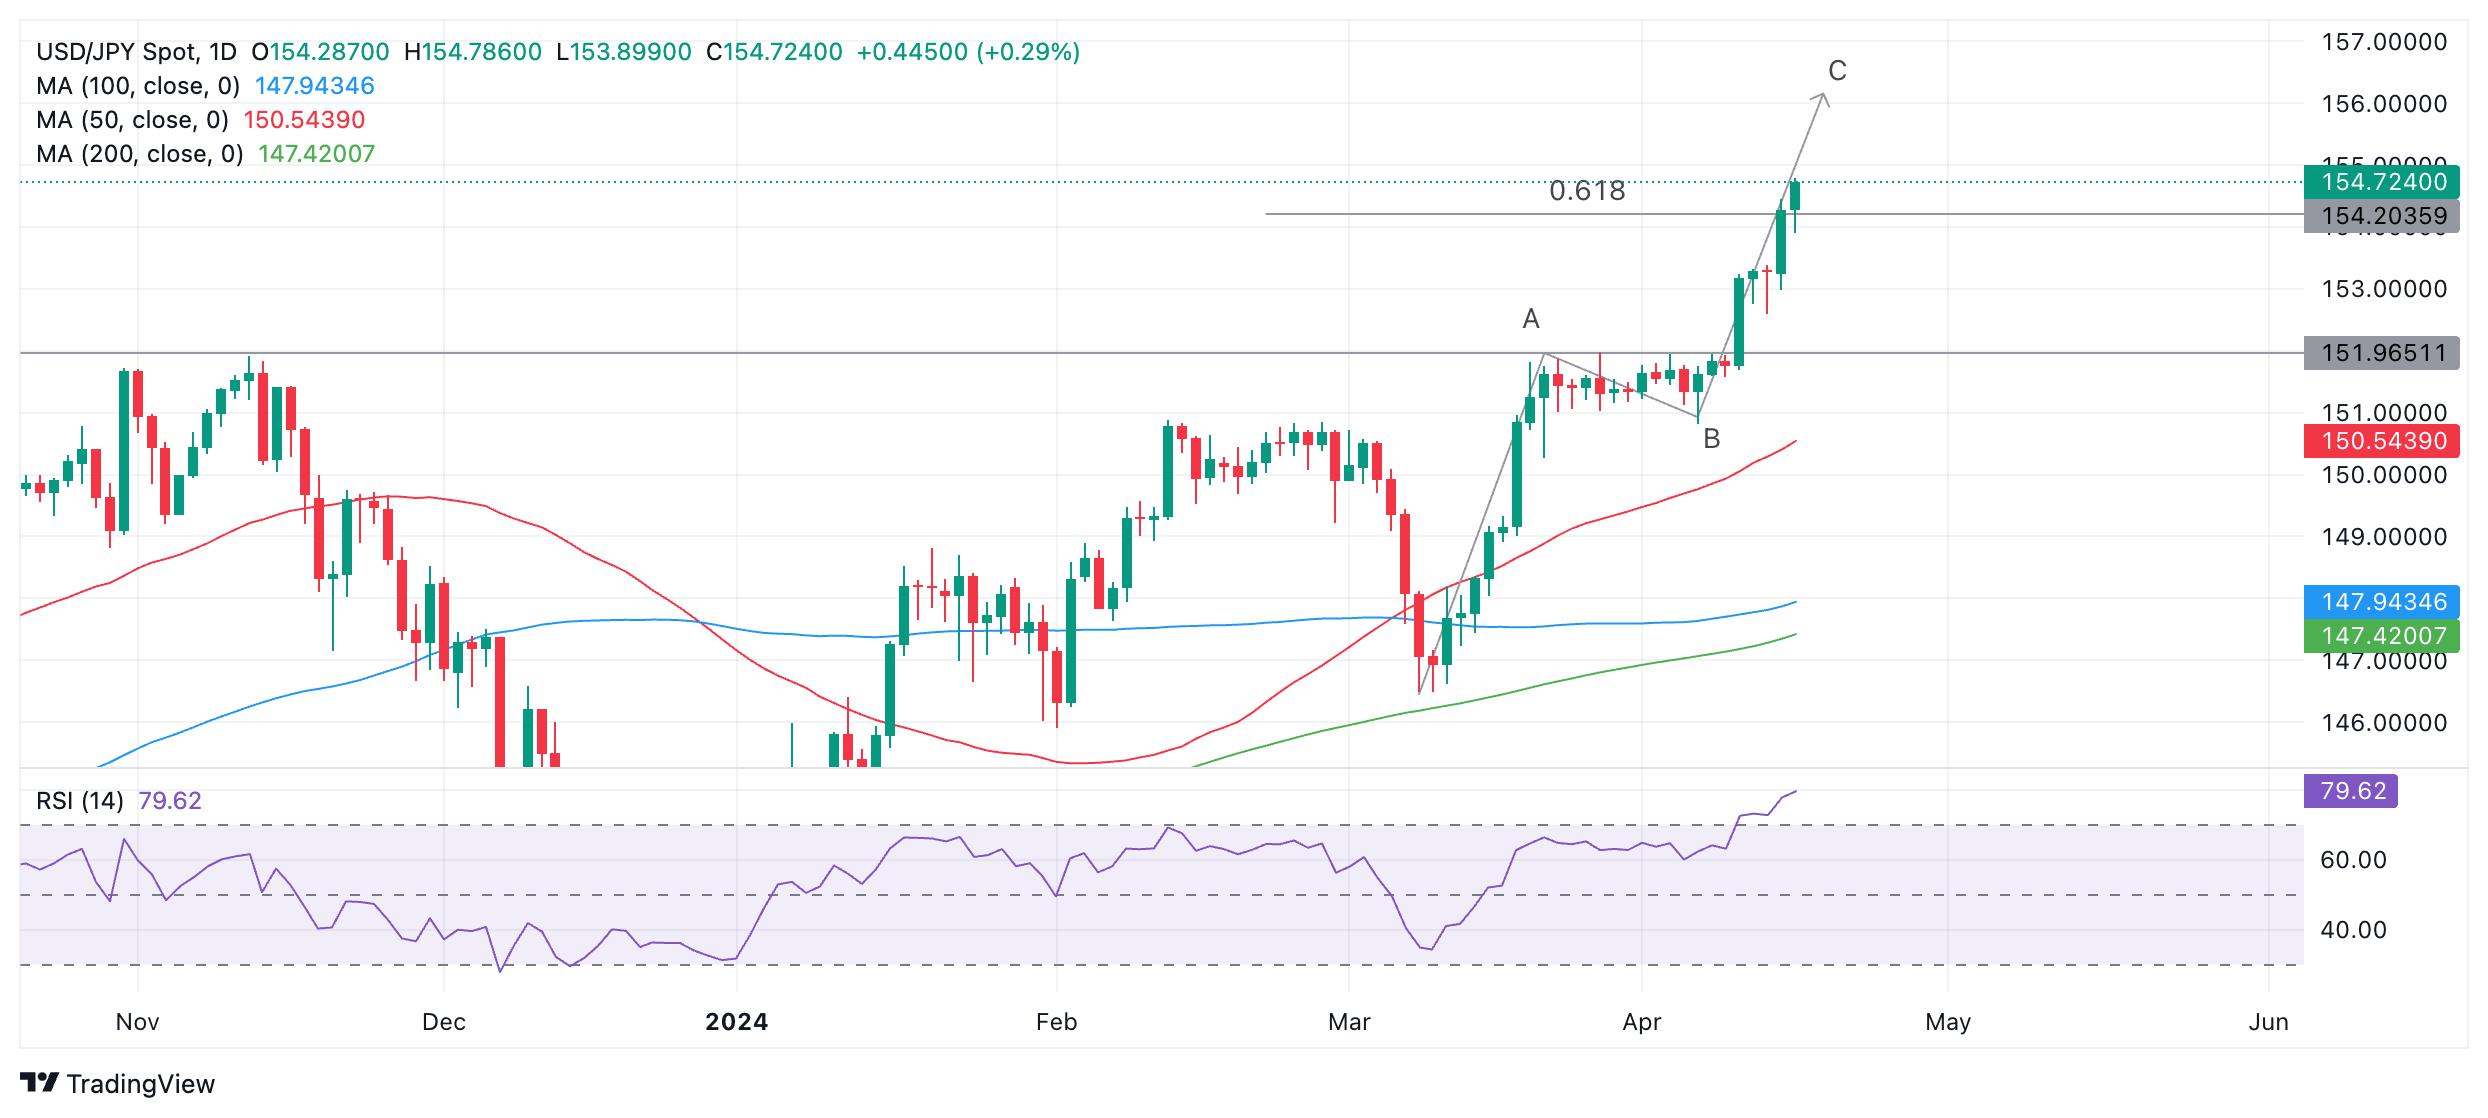
The end of C if it ends equal to A it will reach roughly 156.11 and there is a chance the rally could extend that high.
However, it is also the case that price has already reached the conservative target for the end of wave C at the Fib. 0.618 extension of A, at 154.20, which means there is a possibility it may have unfolded to its limit.
In addition, the Relative Strength Index (RSI) is well into overbought territory, recommending bullish traders with a medium-term outlook should not increase their long bets. If RSI exits overbought it may be a sign USD/JPY is pulling back.
For USD/JPY bulls the important thing is that price itself continues to rise and as long as it does the uptrend is likely to continue.
Reprinted from FXStreet,the copyright all reserved by the original author.
Disclaimer: The content above represents only the views of the author or guest. It does not represent any views or positions of FOLLOWME and does not mean that FOLLOWME agrees with its statement or description, nor does it constitute any investment advice. For all actions taken by visitors based on information provided by the FOLLOWME community, the community does not assume any form of liability unless otherwise expressly promised in writing.
FOLLOWME Trading Community Website: https://www.followme.com


Hot
No comment on record. Start new comment.