NZD/USD Price Analysis: Bears hold sway, subtle signs of potential bullish reversal emerging

- Diminishing red bars of the daily MACD imply a potential easing of bearish momentum, signaling an early indication of a bullish turnaround.
- The hourly chart reveals an RSI oscillating in the positive zone, and MACD with green bars, signaling potential short-term positive momentum.
The NZD/USD pair advanced to 0.5920 on Monday, reflecting a gain of 0.47%. Overall, the bearish force remains strong, while the bulls begin to give signs of potential recovery, highlighting the start of a possible bullish reversal.
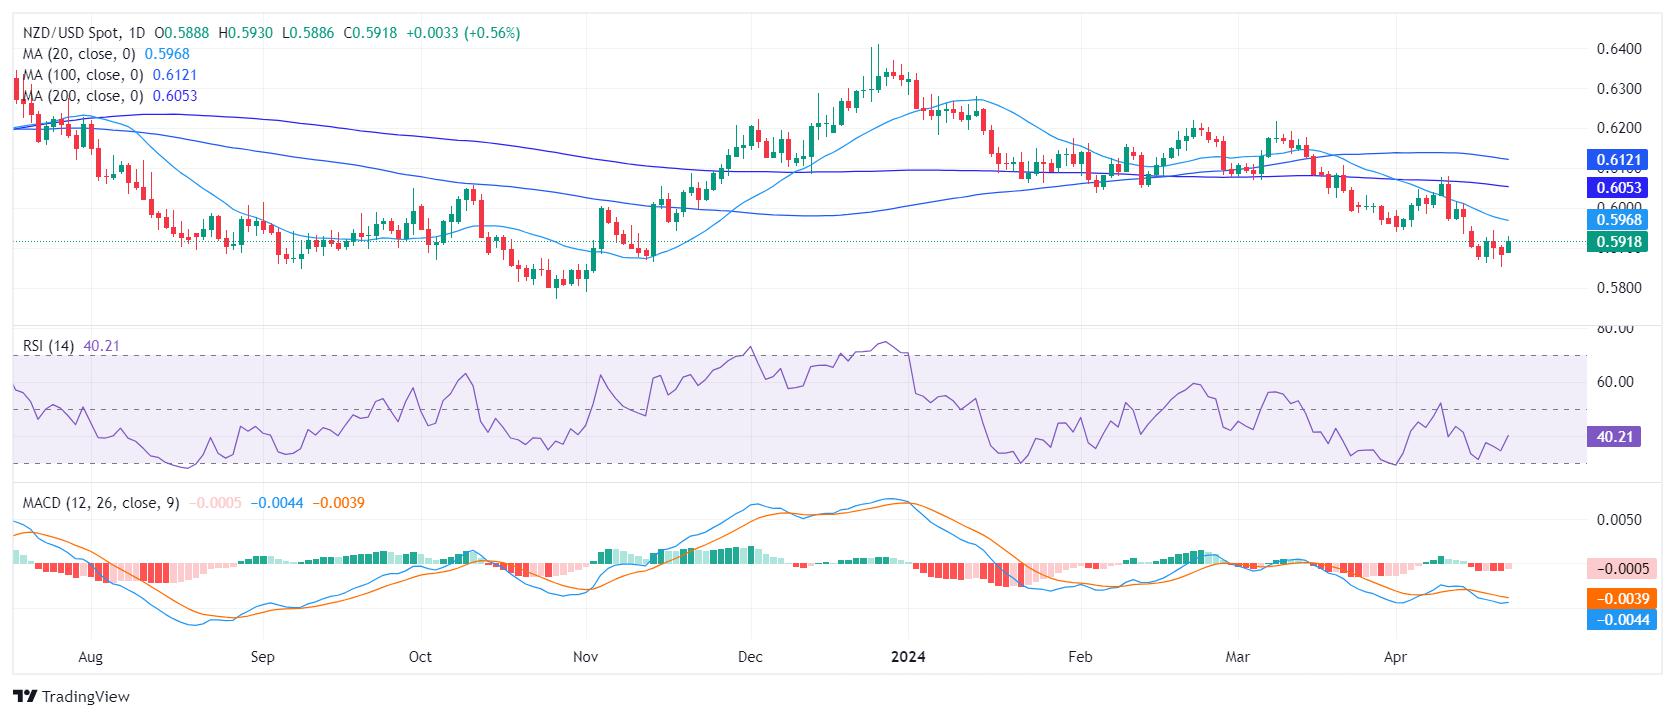
On the daily chart, the Relative Strength Index (RSI) remains in negative territory, indicating an ongoing bearish momentum. Although there is a minor upward trend, it remains short of breaking into the positive zone. The decreasing red bars of the Moving Average Convergence Divergence (MACD) suggest a slide in negative momentum, indicating possible signs of a potential bullish reversal.
NZD/USD daily chart
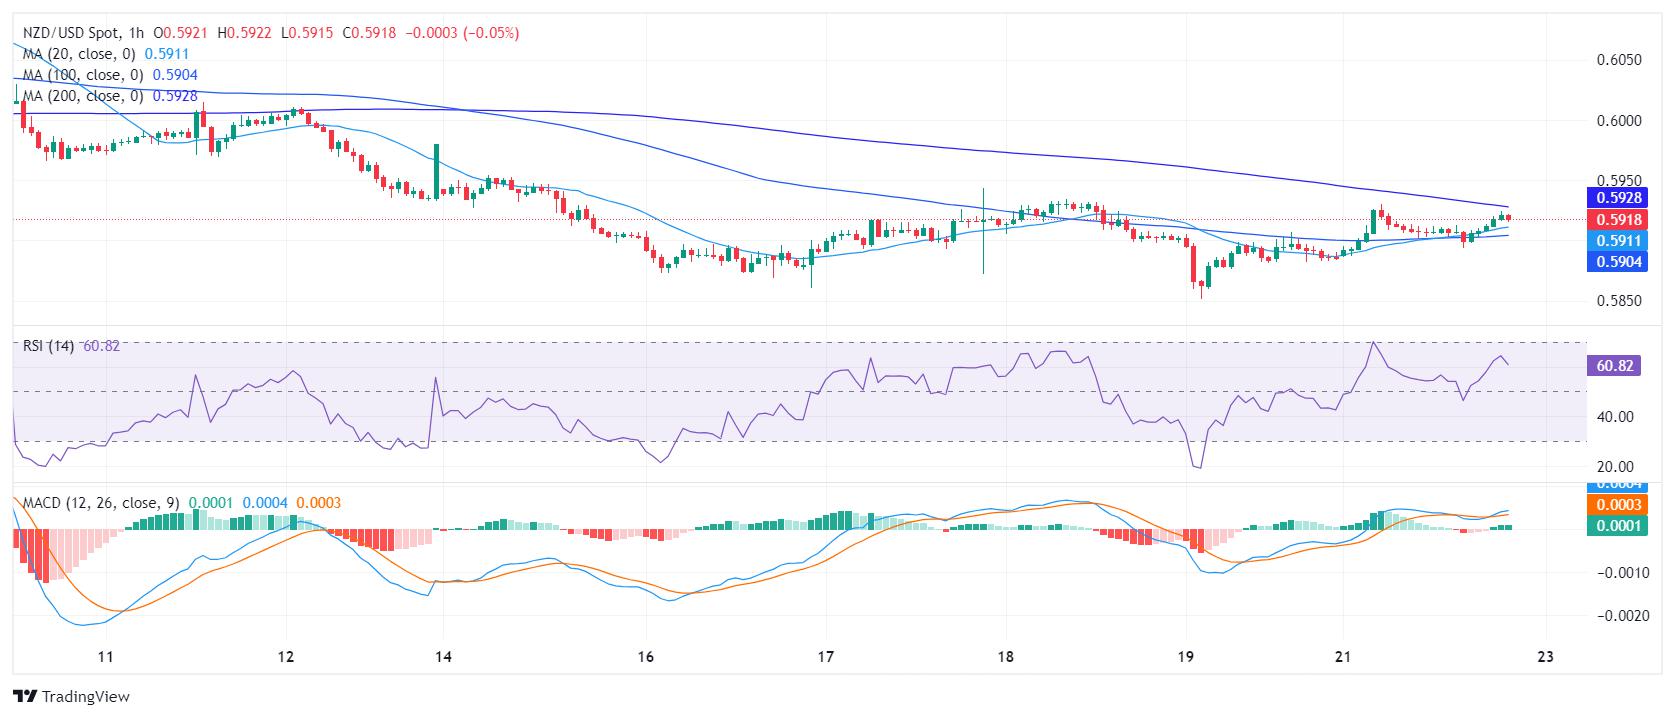
On the hourly chart, a similar condition prevails. The RSI has been oscillating in the positive territory for most of the session, but recently recorded a slight downward inclination, signaling a potential pullback. The MACD histogram also shows rising green bars, indicating a surge in positive momentum.
NZD/USD hourly chart
The broader market perspective reveals much regarding the NZD/USD's performance versus its Simple Moving Average (SMA). With the pair being below the 20,100 and 200-day SMA, a long and short-term downward pressure on the currency is evident.
In summary, there is a bearish dominance in the market, reinforced by both the RSI and MACD trends on the daily and hourly charts, as well as the SMA positioning. However, the slight increase in the daily RSI and the diminishing bearish momentum in the MACD could signify the early stages of a market reversal.
Reprinted from FXStreet,the copyright all reserved by the original author.
Disclaimer: The content above represents only the views of the author or guest. It does not represent any views or positions of FOLLOWME and does not mean that FOLLOWME agrees with its statement or description, nor does it constitute any investment advice. For all actions taken by visitors based on information provided by the FOLLOWME community, the community does not assume any form of liability unless otherwise expressly promised in writing.
FOLLOWME Trading Community Website: https://www.followme.com


Hot
No comment on record. Start new comment.