EUR/USD Price Analysis: Tests the major level of 1.0650; followed by the nine-day EMA

- EUR/USD remains tepid around the major level amid a bearish sentiment.
- A breach below the 1.0600 level may lead the pair toward November’s low at 1.0517.
- The nine-day EMA at 1.0675 appears as the immediate barrier.
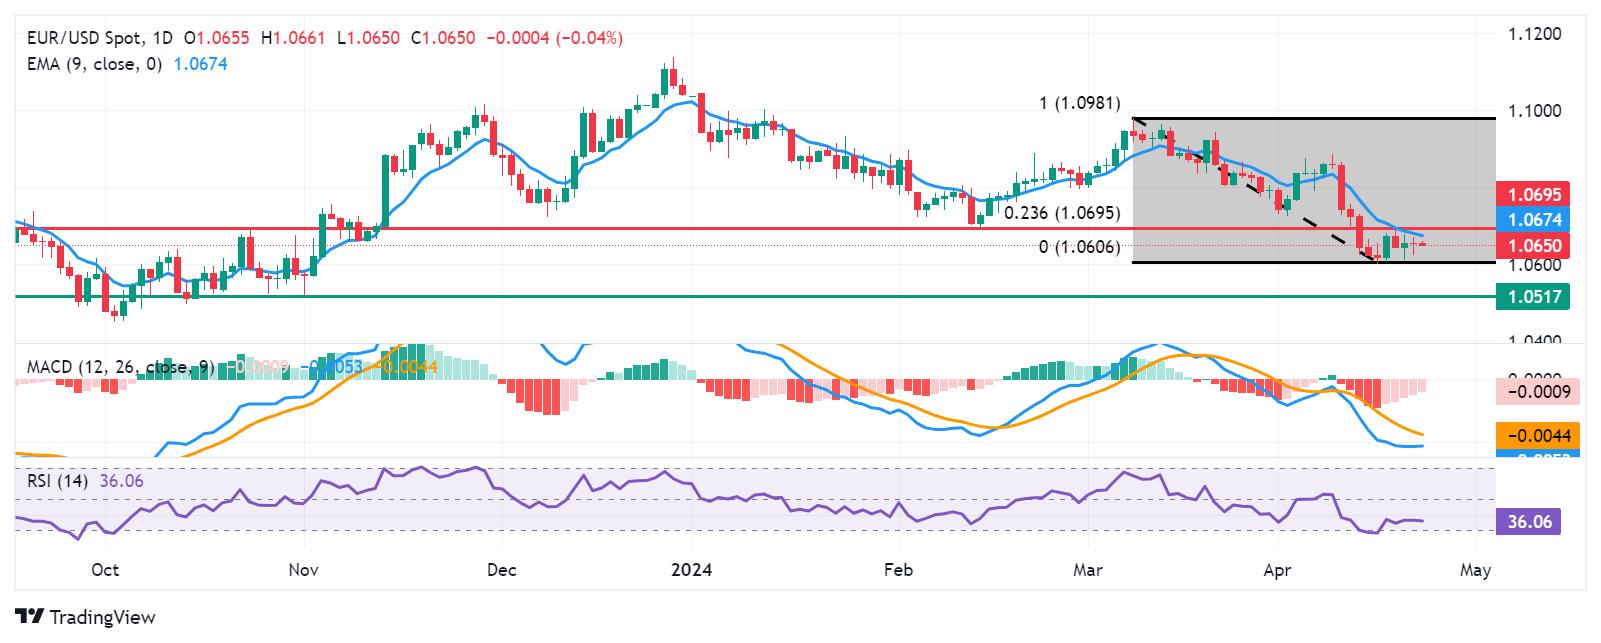
EUR/USD remains lackluster during the Asian trading hours on Tuesday, hovering near 1.0650. From a technical perspective, analysis suggests a bearish sentiment for the pair as it struggles below the pullback resistance at the 1.0695 level. The 14-day Relative Strength Index (RSI) also remains below the 50 mark.
Moreover, the lagging indicator, Moving Average Convergence Divergence (MACD), indicates weakness for the EUR/USD pair as it resides below the centerline and the signal line. Key support for the pair could be found around the psychological level of 1.0600.
A breach below this level may exert downward pressure on the pair, leading it towards the region around the major support level of 1.0550, followed by November’s low at 1.0517.
On the upside, the immediate barrier for the EUR/USD pair could be the nine-day Exponential Moving Average (EMA) at 1.0675. A breakthrough above this level could lead the pair to reach the 1.0695 level, aligning with the 23.6% Fibonacci retracement level drawn between 1.0981 and 1.0606.
Further resistance aligns with the psychological level of 1.0700. A breakthrough above this region could potentially strengthen the recovery sentiment for the pair.
EUR/USD: Daily Chart
Reprinted from FXStreet,the copyright all reserved by the original author.
Disclaimer: The content above represents only the views of the author or guest. It does not represent any views or positions of FOLLOWME and does not mean that FOLLOWME agrees with its statement or description, nor does it constitute any investment advice. For all actions taken by visitors based on information provided by the FOLLOWME community, the community does not assume any form of liability unless otherwise expressly promised in writing.
FOLLOWME Trading Community Website: https://www.followme.com


Hot
No comment on record. Start new comment.