The AUD/USD pair is experiencing upward momentum for the second consecutive day

The AUD/USD pair is experiencing upward momentum for the second consecutive day, reaching a one-week high near 0.6453 on Tuesday. This positive movement comes after a period of rapid decline and is supported by encouraging economic data from Australia.
The latest manufacturing PMI report for April significantly contributed to the Australian dollar's appreciation. It showed an increase to 49.9 points, up from 47.3 the previous month. This improvement brings the manufacturing sector close to the critical 50.0 threshold, distinguishing between the industry's growth and contraction. Additionally, the services PMI reported the most robust expansion in the last three months, and the private sector experienced its fastest growth in two years during April.
These robust economic reports not only indicate a resilient economy but also carry pro-inflationary implications. They bolster the outlook that the Reserve Bank of Australia (RBA) may maintain higher interest rates for an extended period to manage inflationary pressures effectively.
Investors will also pay attention to the upcoming release of inflation statistics later in the week, which will provide further insights into the economic factors influencing the RBA's monetary policy decisions.
Moreover, the Australian dollar's gains were further supported by a reduction in investor concerns over geopolitical risks in the Middle East, contributing to a more favourable risk environment.
Technical analysis of AUD/USD
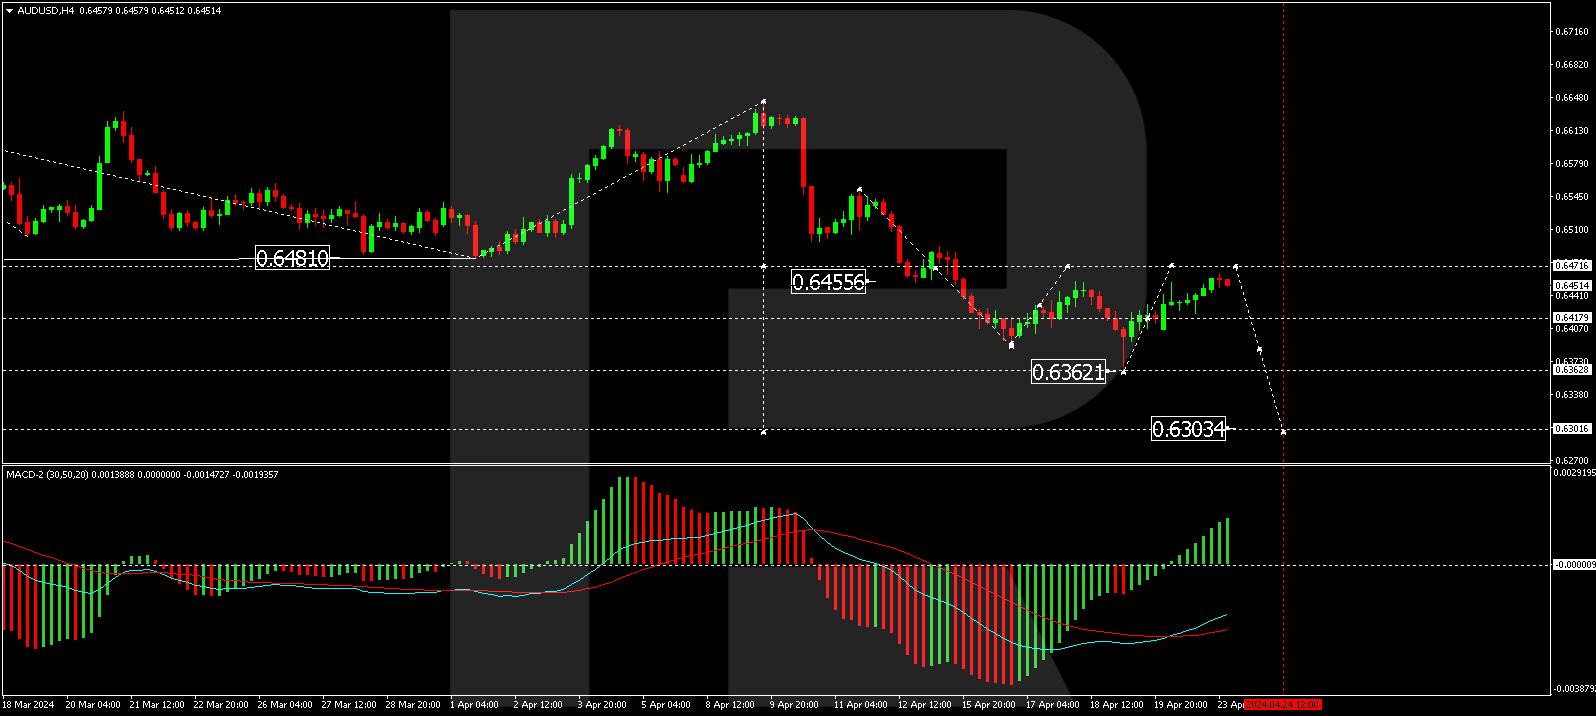
On the H4 chart, the AUD/USD pair completed a declining wave to 0.6362. A corrective movement towards 0.6471 is underway. Upon completion of this correction, a continuation of the downward trend towards 0.6300 is anticipated. The MACD indicator supports this bearish outlook despite its signal line being above zero, which typically suggests growth potential.
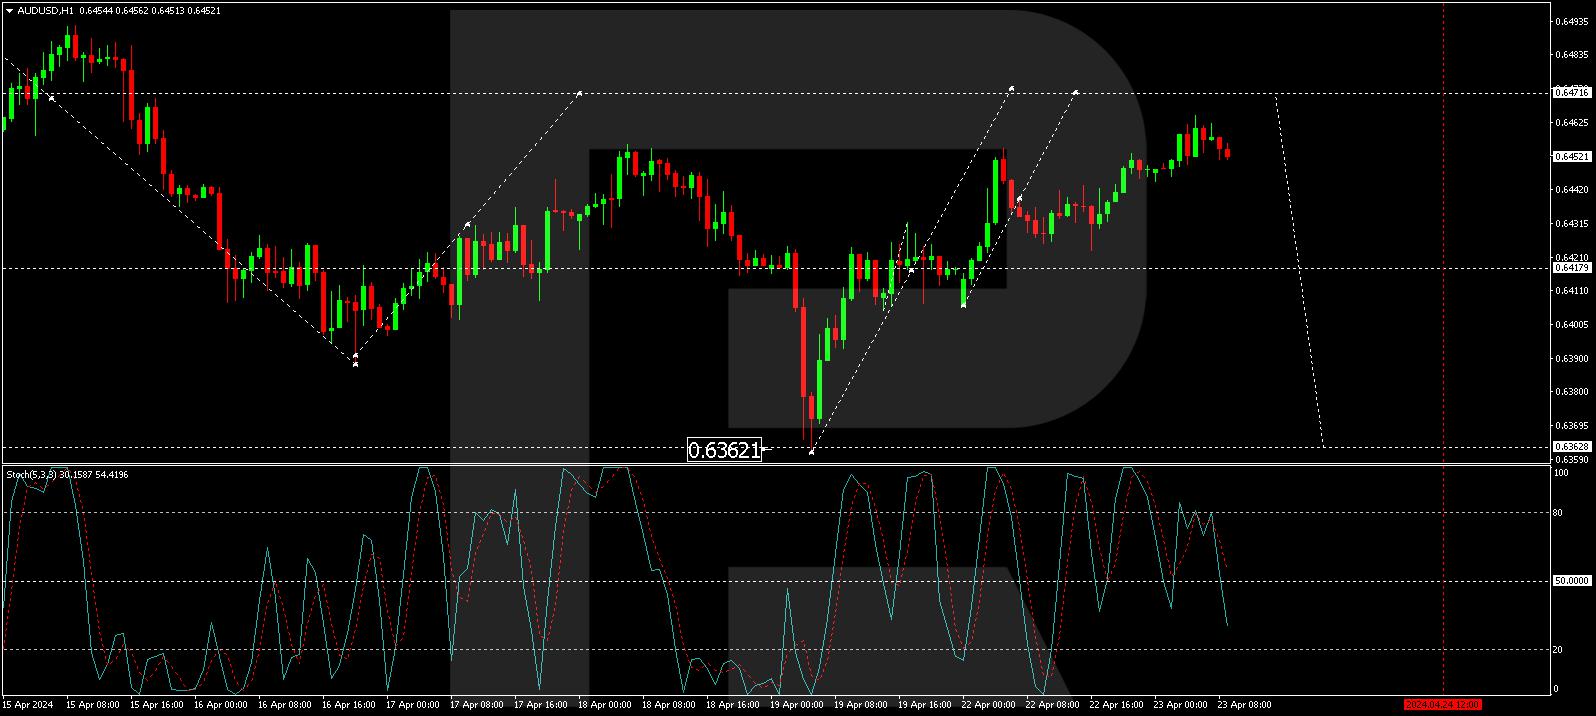
On the H1 chart, a consolidation range has been formed around 0.6417. A breakout above this range could lead to a rise towards 0.6471. Following this peak, a new downward wave to 0.6363 is expected. Breaking below this level may pave the way to reach 0.6300. The Stochastic oscillator, with its signal line currently below 80 and pointing downwards, confirms this potential downward trajectory.
Reprinted from FXStreet,the copyright all reserved by the original author.
Disclaimer: The content above represents only the views of the author or guest. It does not represent any views or positions of FOLLOWME and does not mean that FOLLOWME agrees with its statement or description, nor does it constitute any investment advice. For all actions taken by visitors based on information provided by the FOLLOWME community, the community does not assume any form of liability unless otherwise expressly promised in writing.
FOLLOWME Trading Community Website: https://www.followme.com


Hot
No comment on record. Start new comment.