Silver Price Analysis: Silver price finds floor but is still at risk of more weakness

- Silver price finds support at $26.70 but remains at risk of further weakness.
- It formed a pattern on the 4-hour chart after touching the top of a four-year consolidation at $30.00.
- XAG/USD has fallen to an initial target but is vulnerable to further declines – support is at $25.80.
Silver (XAG/USD) price has found a floor at $26.70 and is consolidating. This follows a sell off that reversed the short-term uptrend after Silver was rejected by the top of a long-term range at just below $30.00 (green line).
The precious metal formed a bullish Hammer candlestick pattern on the daily chart, on Tuesday (circled below).
Silver Daily Chart
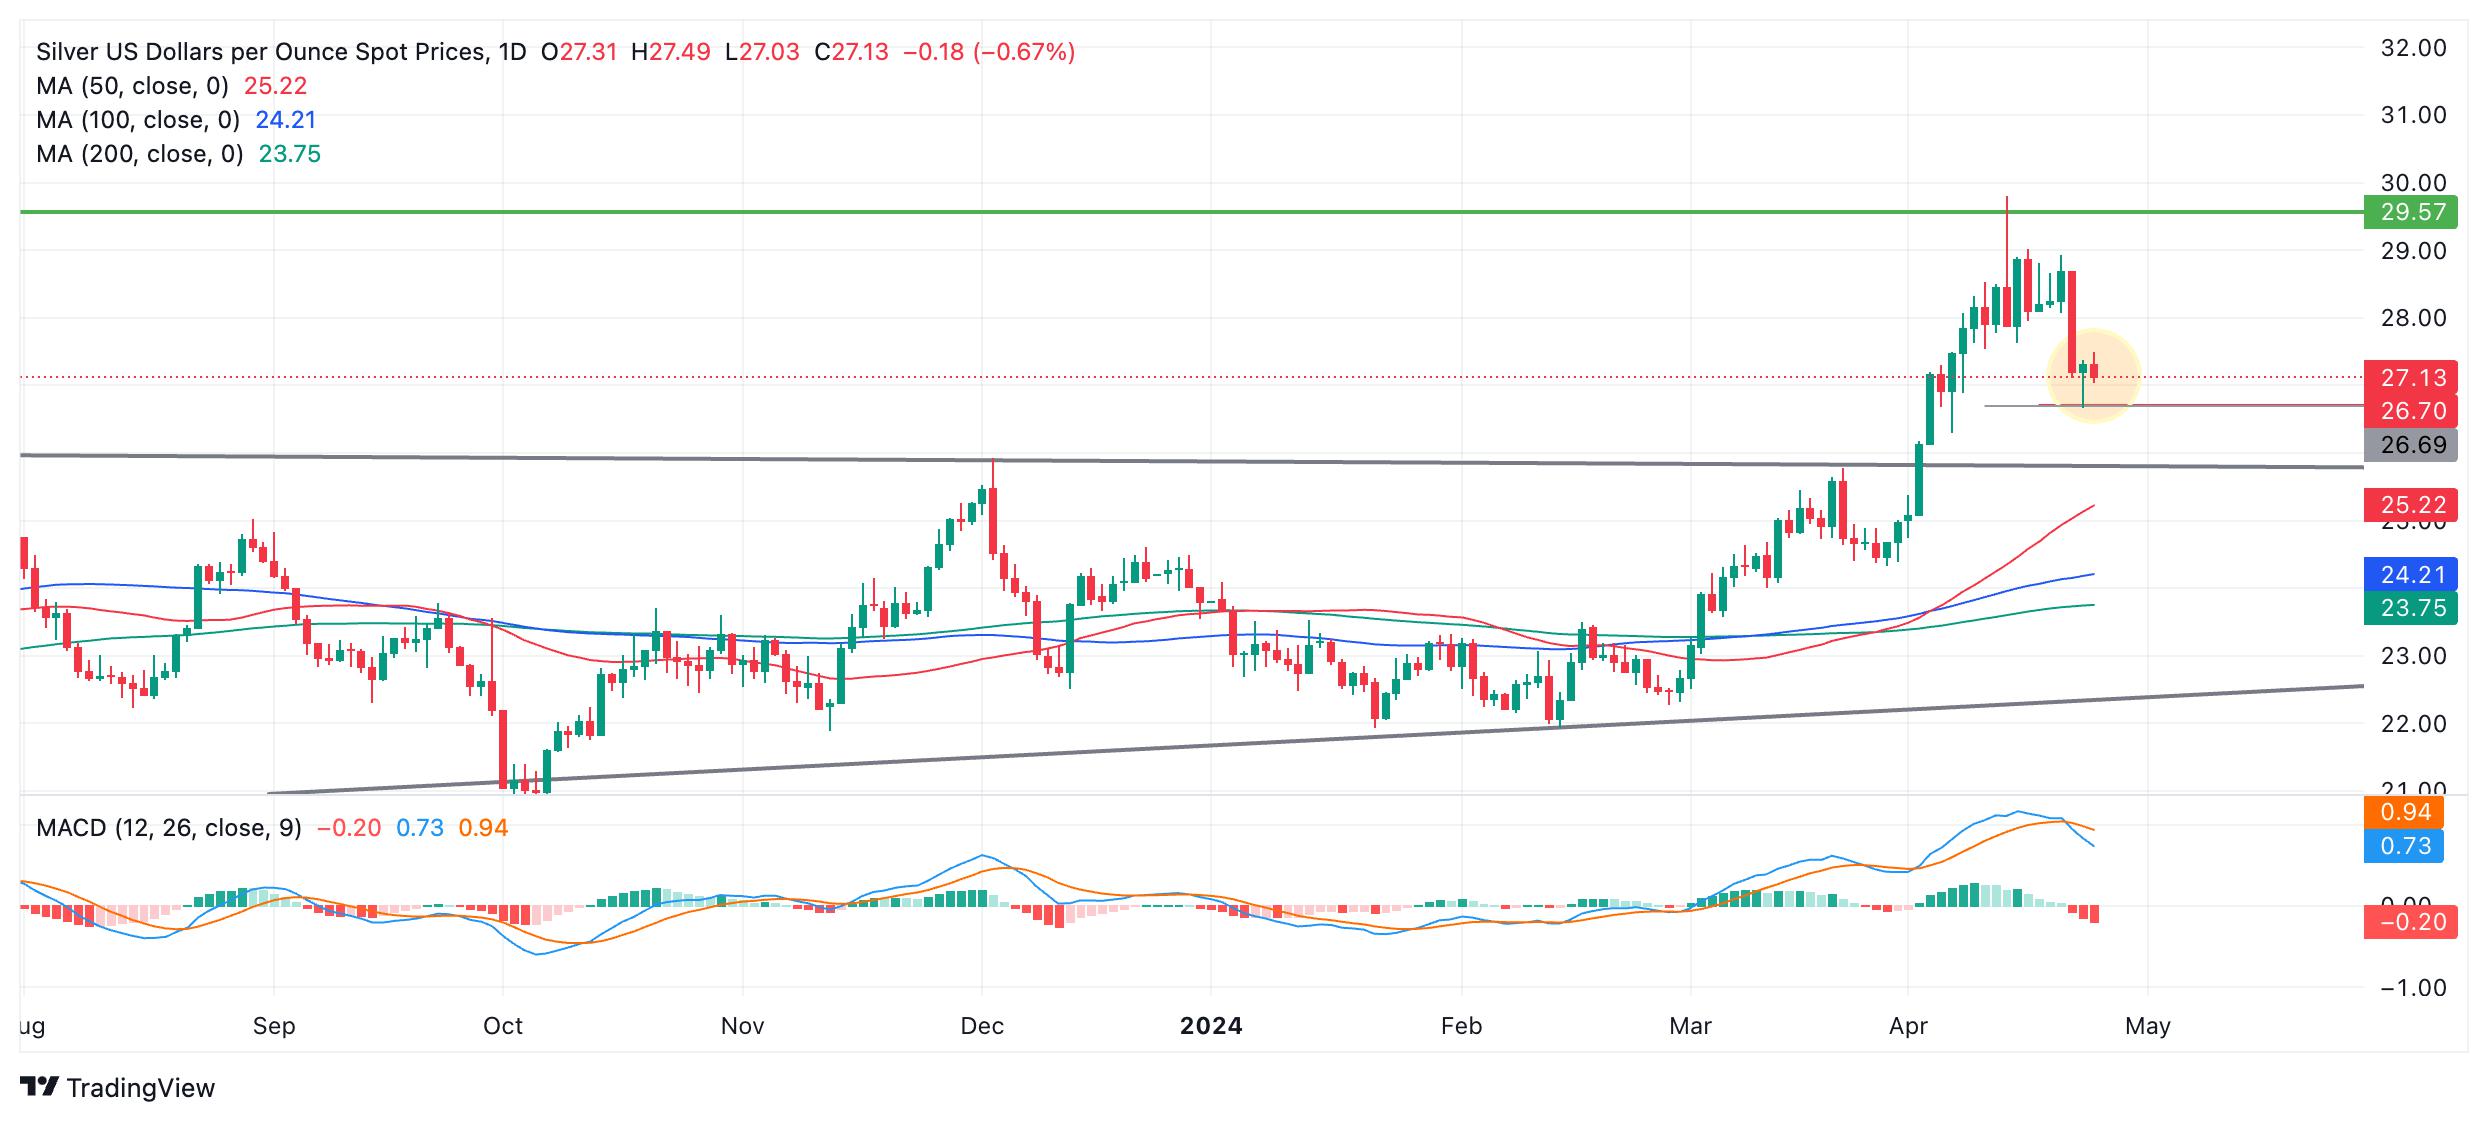
If the Hammer is followed by a green up candle on Wednesday confirming the bullish change in sentiment, it could signal a possible short-term correction higher. If not Silver price is at risk of more downside. A break below the low of the hammer would provide confirmation of more weakness. The next downside target would probably be at support from the top of the year-long range at around $25.80.
The Moving Average Convergence/Divergence (MACD) momentum indicator has crossed below its signal line, indicating more weakness is likely. The signal is reinforced by the fact that MACD has been proven to be a more reliable indicator in markets that are not strongly trending, such as is the case with Silver.
A decisive break below $25.80 would return Silver to inside its year-long range and possibly the lower trendline at roughly $23.00.
From a bullish perspective, a decisive break above the 2021 high of $30.07 would suggest Silver was going higher, with an initial target at $32.40 where former resistance lies.
4-hour Chart
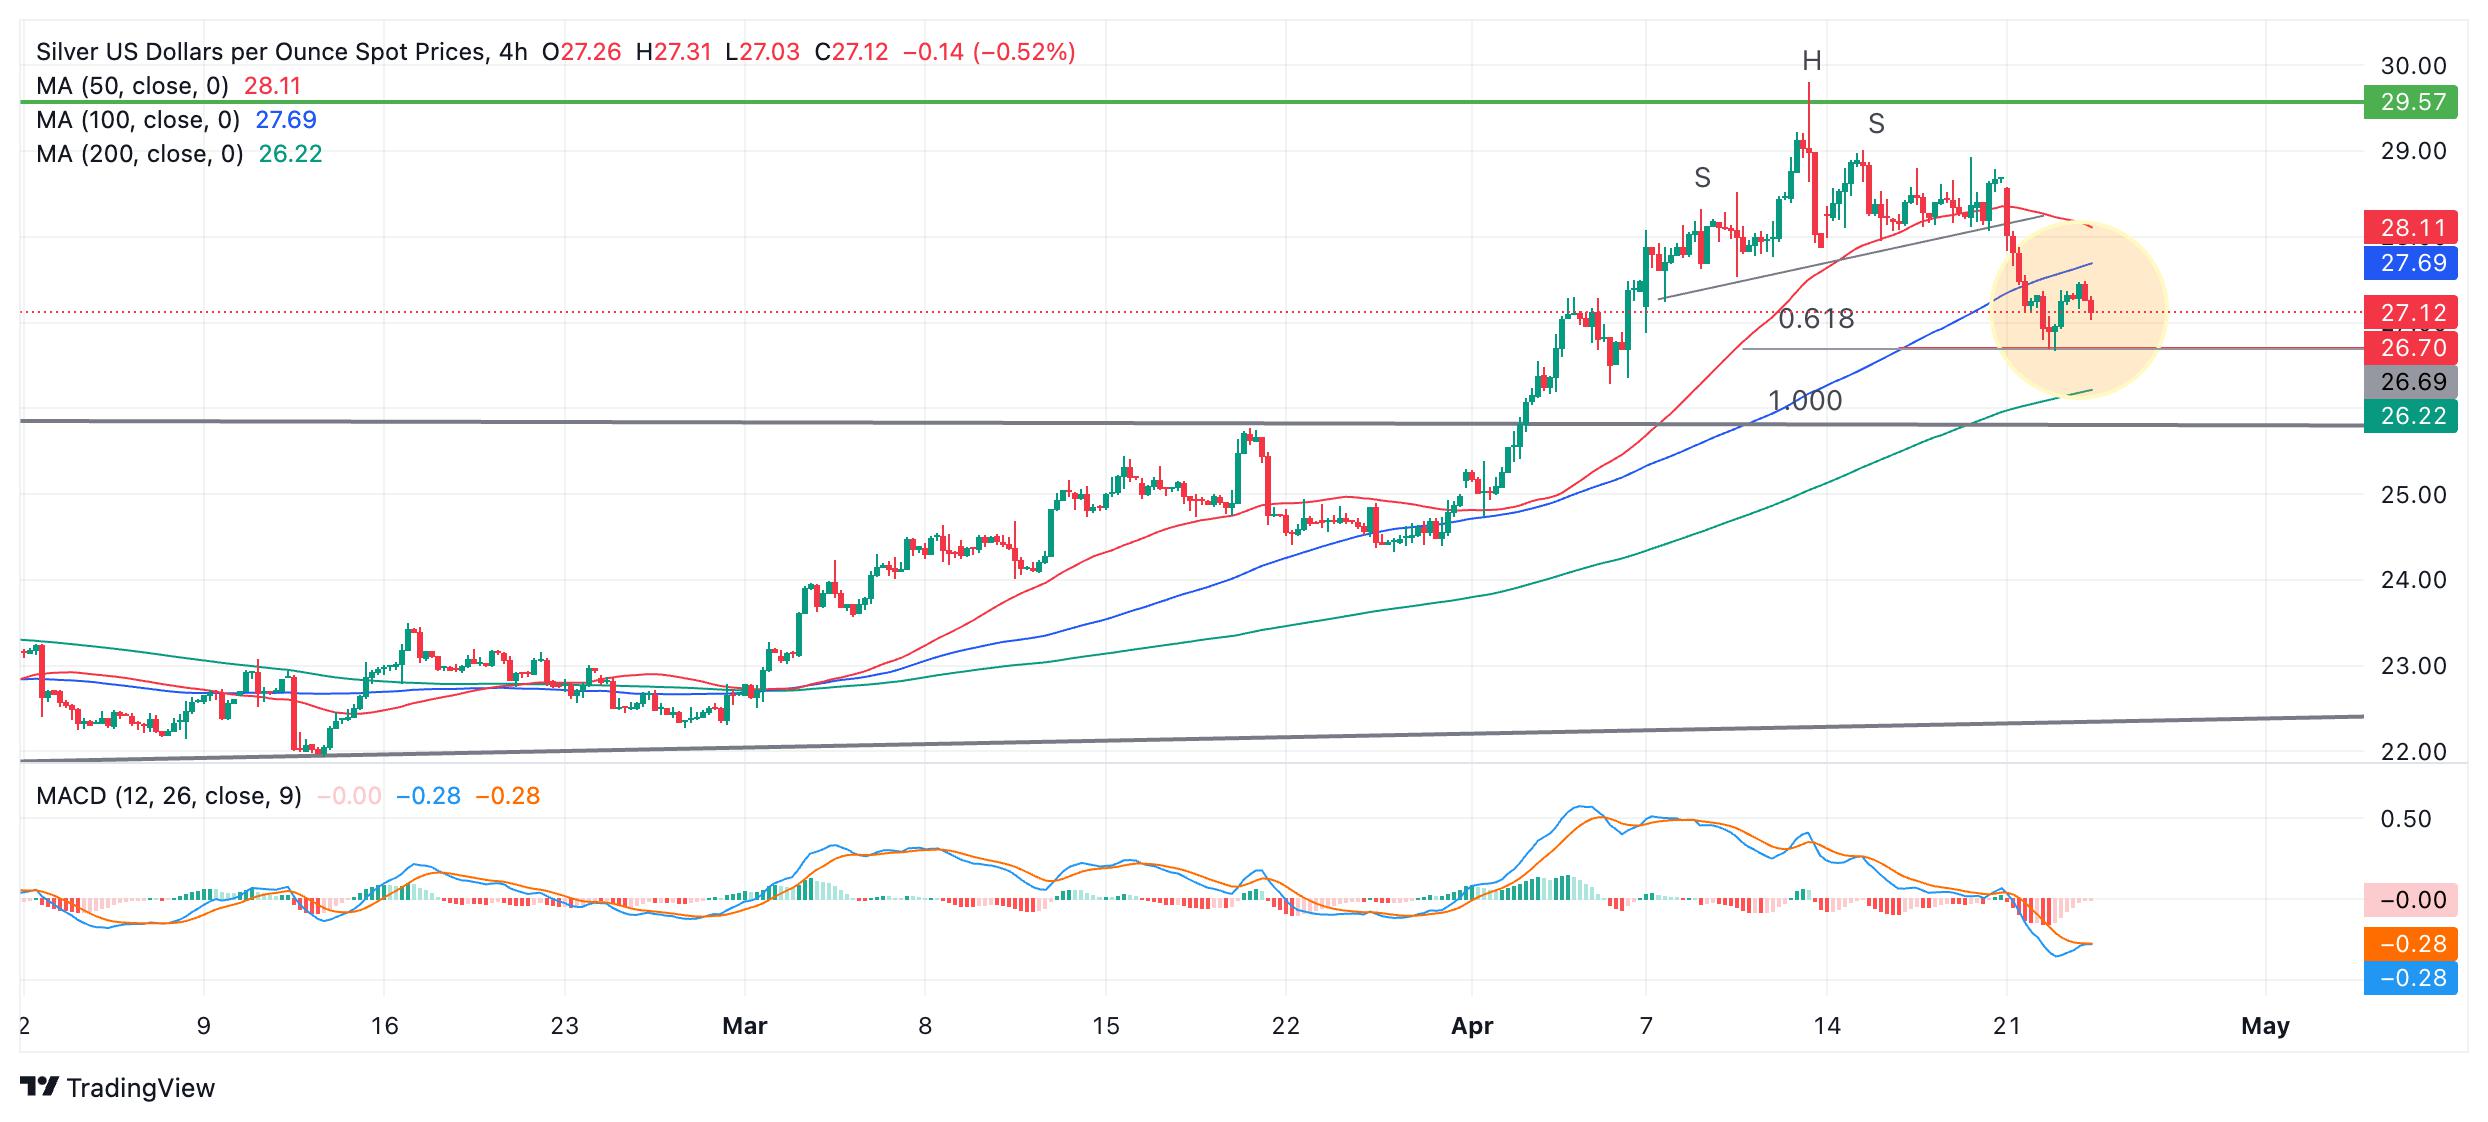
The 4-hour chart which analysts often use to determine the short-term trend, shows in more detail the price dynamics that preceded the fall from the top of the four-year consolidation zone (green line).
Silver price formed a multi-shouldered Head and Shoulders (H&S) topping pattern at the $30.00 highs of mid-April.
When the pattern broke below its “neckline” at the base, at roughly $28.00, it fell sharply to an initial target at $26.70. This target is the conservative estimate for the pattern, calculated by taking the height of the H&S and extrapolating the distance by a 0.618 Fibonacci ratio from the neckline lower.
If the pattern falls further to its optimistic target, which lies at the full distance of the height of the pattern extrapolated lower (Fib.1.000), it will reach a target at roughly the same level as the top of the year-long range at around $25.80.
Reprinted from FXStreet,the copyright all reserved by the original author.
Disclaimer: The content above represents only the views of the author or guest. It does not represent any views or positions of FOLLOWME and does not mean that FOLLOWME agrees with its statement or description, nor does it constitute any investment advice. For all actions taken by visitors based on information provided by the FOLLOWME community, the community does not assume any form of liability unless otherwise expressly promised in writing.
FOLLOWME Trading Community Website: https://www.followme.com


Hot
No comment on record. Start new comment.