EUR/USD Price Analysis: Moves above 1.0700, next barrier at 21-day EMA

- EUR/USD could approach the 21-day EMA at 1.0727.
- A break below 1.0700 could lead the pair toward the major support of 1.0650 and April’s low at 1.0601.
- A breach above the major level of 1.0695 suggests a weakening of bearish sentiment.
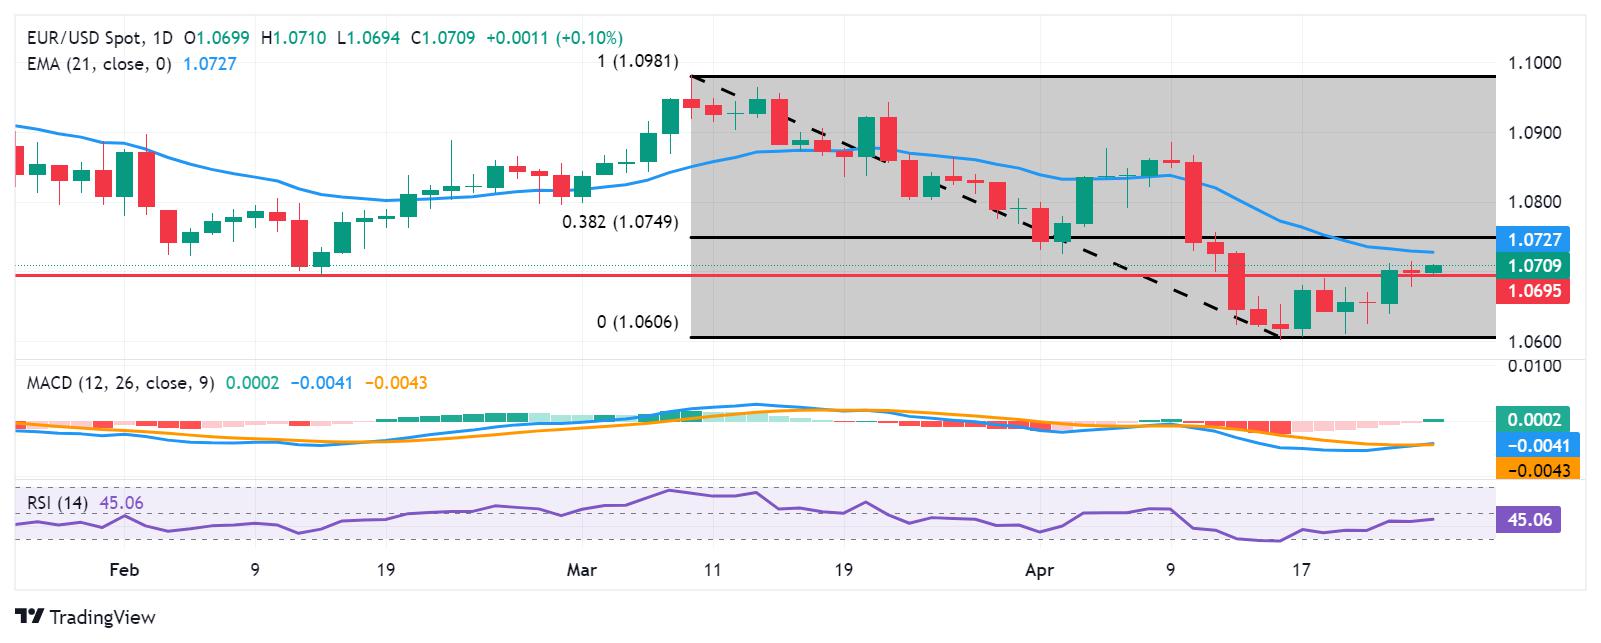
EUR/USD recovers its recent losses registered in the previous session, trading around 1.0710 during the Asian session on Thursday. From a technical standpoint, analysis suggests a weakening of bearish sentiment for the pair as it has surpassed the major level of 1.0695 and the psychological level of 1.0700.
Additionally, the lagging indicator Moving Average Convergence Divergence (MACD) indicates a shift in momentum for the EUR/USD pair, as it is positioned below the centerline but above the signal line. However, the 14-day Relative Strength Index (RSI) remains below the 50-mark, indicating a continuation of bearish momentum.
Key support for the EUR/USD pair is likely to be found around the psychological level of 1.0700. A breach below this level could apply downward pressure on the pair, potentially leading it toward the region surrounding the major support level of 1.0650. Further support may be identified around April’s low at 1.0601, which aligns with the psychological level of 1.0600.
On the upside, the immediate barrier for the pair could be the 21-day Exponential Moving Average (EMA) at 1.0727. A breakthrough above this level could propel the pair towards the 38.2% Fibonacci retracement level at 1.0749, which is drawn between the levels of 1.0981 and 1.0606, coinciding with the major level of 1.0750.
EUR/USD: Daily Chart
Reprinted from FXStreet,the copyright all reserved by the original author.
Disclaimer: The content above represents only the views of the author or guest. It does not represent any views or positions of FOLLOWME and does not mean that FOLLOWME agrees with its statement or description, nor does it constitute any investment advice. For all actions taken by visitors based on information provided by the FOLLOWME community, the community does not assume any form of liability unless otherwise expressly promised in writing.
FOLLOWME Trading Community Website: https://www.followme.com


Hot
No comment on record. Start new comment.