
· Views 91
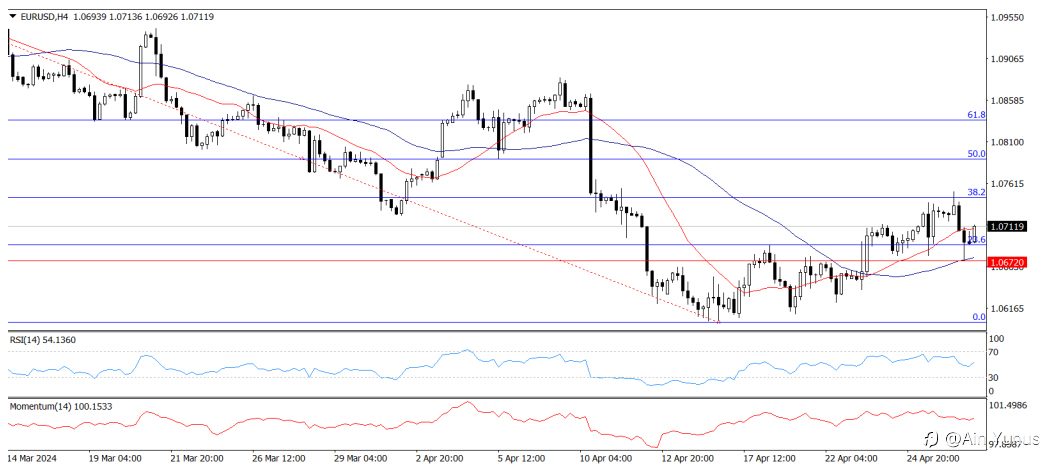
Looking at the 4-hour chart, you can see that the EUR/USD has bounced back from the support level at Fibonacci 23.6%, which suggests an increasing trend. For the Fibonacci 38.2% level, $1.0750 should be next resistance point. If the pair stays stable above this level, the next resistance point should be $1.0835 which is the Fibonacci 61.8% level. So based on this positive analysis, I would like to invite you to be a part of our team to gain knowledge and earn more income every month.
#businessopportunity #businesspartner #financialindustry #financialfreedom #hiring #empowerment #partnershipopportunity #earnmoney #workbenefits #successfulcareer #careerdevelopment #increaseincome #exness #xm #octafx #trading #Tickmill# #KVB#

Disclaimer: The content above represents only the views of the author or guest. It does not represent any views or positions of FOLLOWME and does not mean that FOLLOWME agrees with its statement or description, nor does it constitute any investment advice. For all actions taken by visitors based on information provided by the FOLLOWME community, the community does not assume any form of liability unless otherwise expressly promised in writing.
FOLLOWME Trading Community Website: https://www.followme.com


Hot
-THE END-