amking
USD/JPY: THE QUOTES ARE FORMING A NEW WAVE OF GROWTH
ScenarioTimeframeWeeklyRecommendationBUY STOPEntry Point156.00Take Profit158.30Stop Loss155.00Key Levels151.80, 154.30, 156.00, 158.30Alternative scenarioRecommendationSELL STOPEntry Point154.30Take Profit151.80Stop Loss155.00Key Levels151.80, 154.30, 156.00, 158.30Current trend The USD/JPY pair is
MORNING MARKET REVIEW
EUR/USD The EUR/USD pair shows a moderate decline, developing a weak "bearish" momentum formed the day before. The instrument is testing 1.0740 for a breakdown, while investors are expecting new drivers for the movement of quotes. Trading participants today assess the March statistics on Industrial
WTI CRUDE OIL: A REPORT FROM THE API RECORDED A WEEKLY DECLINE IN “BLACK GOLD” RESERVES BY 1.43M BARRELS
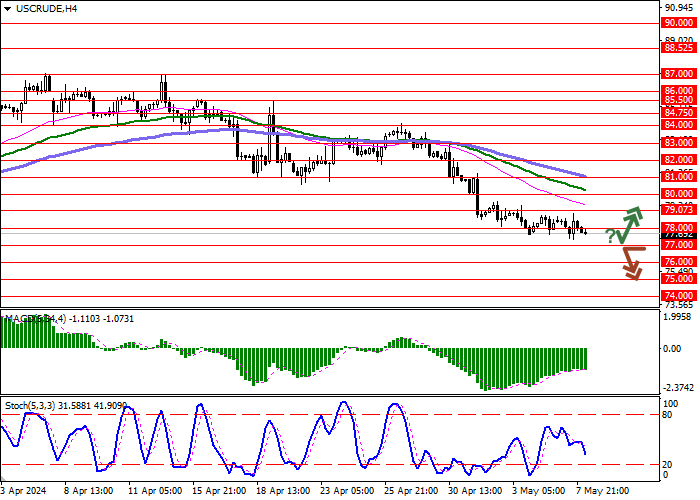
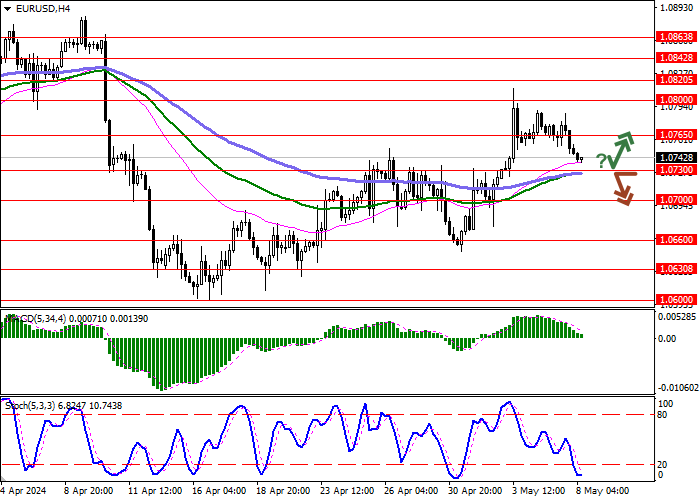
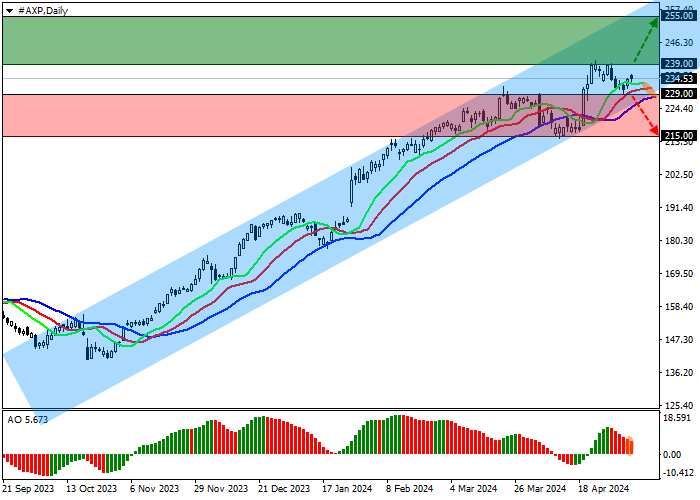
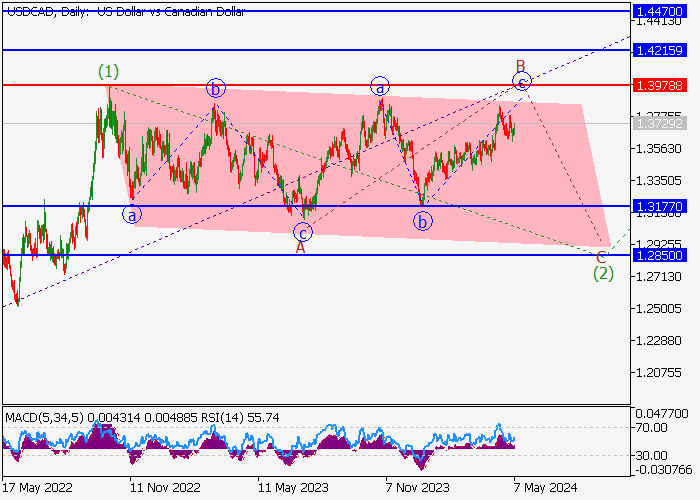
ScenarioTimeframeIntradayRecommendationSELL STOPEntry Point77.00Take Profit75.00Stop Loss78.00Key Levels75.00, 76.00, 77.00, 78.00, 79.07, 80.00, 81.00, 82.00Alternative scenarioRecommendationBUY STOPEntry Point78.00Take Profit80.00Stop Loss77.00Key Levels75.00, 76.00, 77.00, 78.00, 79.07, 80.00, 81
EUR/USD: THE EURO DEVELOPS THE "BEARISH" IMPETUS FORMED THE DAY BEFORE
ScenarioTimeframeIntradayRecommendationSELL STOPEntry Point1.0730Take Profit1.0660Stop Loss1.0765Key Levels1.0630, 1.0660, 1.0700, 1.0730, 1.0765, 1.0800, 1.0820, 1.0842Alternative scenarioRecommendationBUY STOPEntry Point1.0765Take Profit1.0820Stop Loss1.0730Key Levels1.0630, 1.0660, 1.0700, 1.0730
GBP/USD: BUSINESS ACTIVITY IN THE UK CONSTRUCTION SECTOR IS RECOVERING STRONGLY
ScenarioTimeframeIntradayRecommendationSELL STOPEntry Point1.2450Take Profit1.2350Stop Loss1.2500Key Levels1.2300, 1.2350, 1.2400, 1.2450, 1.2500, 1.2539, 1.2573, 1.2600Alternative scenarioRecommendationBUY STOPEntry Point1.2500Take Profit1.2600Stop Loss1.2450Key Levels1.2300, 1.2350, 1.2400, 1.2450
BANK OF AMERICA CORP.: TECHNICAL ANALYSIS
ScenarioTimeframeWeeklyRecommendationBUY STOPEntry Point38.50Take Profit41.20Stop Loss37.50Key Levels34.00, 36.00, 37.50, 38.00, 38.50, 41.20, 41.50Alternative scenarioRecommendationSELL STOPEntry Point36.80Take Profit34.10Stop Loss38.00Key Levels34.00, 36.00, 37.50, 38.00, 38.50, 41.20, 41.50Shares
AMERICAN EXPRESS CO.: TECHNICAL ANALYSIS
ScenarioTimeframeWeeklyRecommendationBUY STOPEntry Point239.00Take Profit255.00Stop Loss234.00Key Levels215.00, 228.00, 229.00, 236.00, 260.00, 234.00, 250.00, 255.00Alternative scenarioRecommendationSELL STOPEntry Point229.00Take Profit215.00Stop Loss236.00Key Levels215.00, 228.00, 229.00, 236.00,
MASTERCARD INC.: WAVE ANALYSIS
ScenarioTimeframeWeeklyRecommendationSELLEntry Point452.98Take Profit409.50, 384.73Stop Loss489.50Key Levels384.73, 409.50, 489.50, 510.00, 530.00Alternative scenarioRecommendationBUY STOPEntry Point489.55Take Profit510.00, 530.00Stop Loss482.75Key Levels384.73, 409.50, 489.50, 510.00, 530.00The pri
VISA INC.: WAVE ANALYSIS
ScenarioTimeframeWeeklyRecommendationBUYEntry Point276.70Take Profit300.00, 310.00Stop Loss266.55Key Levels251.85, 259.50, 266.55, 300.00, 310.00Alternative scenarioRecommendationSELL STOPEntry Point266.50Take Profit259.50, 251.85Stop Loss268.83Key Levels251.85, 259.50, 266.55, 300.00, 310.00Growth
USD/CHF: WAVE ANALYSIS
ScenarioTimeframeWeeklyRecommendationSELLEntry Point0.9092Take Profit0.8323, 0.8000Stop Loss0.9220Key Levels0.8000, 0.8323, 0.9220, 0.9540, 0.9764Alternative scenarioRecommendationBUY STOPEntry Point0.9225Take Profit0.9540, 0.9764Stop Loss0.9120Key Levels0.8000, 0.8323, 0.9220, 0.9540, 0.9764A fall
USD/CAD: WAVE ANALYSIS
ScenarioTimeframeWeeklyRecommendationSELLEntry Point1.3753Take Profit1.3177, 1.2850Stop Loss1.3978Key Levels1.2850, 1.3177, 1.3978, 1.4215, 1.4470Alternative scenarioRecommendationBUY STOPEntry Point1.3980Take Profit1.4215, 1.4470Stop Loss1.3900Key Levels1.2850, 1.3177, 1.3978, 1.4215, 1.4470The pri
HK50: ICHIMOKU INDICATORS ANALYSIS
ScenarioTimeframeIntradayRecommendationBUYEntry Point18513.2Take Profit18808.4Stop Loss18206.8Key Levels18203.6,18206.8,18808.4,18813.<wbr>0Let's look at the four-hour chart. Tenkan-sen line is above Kijun-sen, the red line is directed upwards, while the blue one remains horizontal. Confirmati
EUR/CAD: ICHIMOKU INDICATORS ANALYSIS
ScenarioTimeframeIntradayRecommendationBUYEntry Point1.4767Take Profit1.4886Stop Loss1.4727Key Levels1.4705, 1.4727, 1.4886, 1.4946Let's look at the four-hour chart. Tenkan-sen line is above Kijun-sen, the lines are horizontal . Confirmative line Chikou Span is above the price chart, current cloud i
ETH/BTC: ICHIMOKU INDICATORS ANALYSIS
ScenarioTimeframeIntradayRecommendationSELLEntry Point0.0482Take Profit0.0361Stop Loss0.0523Key Levels0.0302, 0.0361, 0.0523, 0.0543Let's look at the four-hour chart. Tenkan-sen line is below Kijun-sen, both lines are directed downwards. Confirmative line Chikou Span is below the price chart, curren
CAD/JPY: ICHIMOKU INDICATORS ANALYSIS
ScenarioTimeframeIntradayRecommendationBUYEntry Point112.904Take Profit114.100Stop Loss112.494Key Levels112.300, 112.494, 114.100, 114.724Let's look at the four-hour chart. Tenkan-sen line is crossing Kijun-sen from below, the blue line is directed downwards, while the red one remains horizontal. Co
Pull-up Update